Introduction
Our camper van now has three different "smart" energy-related devices, all of which require their own phone app to view their status:
I was getting tired of constantly pulling out my phone to check these three apps—I'd much rather disconnect and be phone-free on our camping trips. However, I still really like knowing how the van's systems are doing. So I put together van-monitor, a central display that shows all of our van's key stats in one place.
Overview
This project consists of an e-paper display mounted in a 3D-printed frame, with a Raspberry Pi Zero W in the back which grabs stats from all the devices via Bluetooth and drives the display. The display updates every 5 seconds, and the whole thing is always on as long as the rest of the van's house power is on.
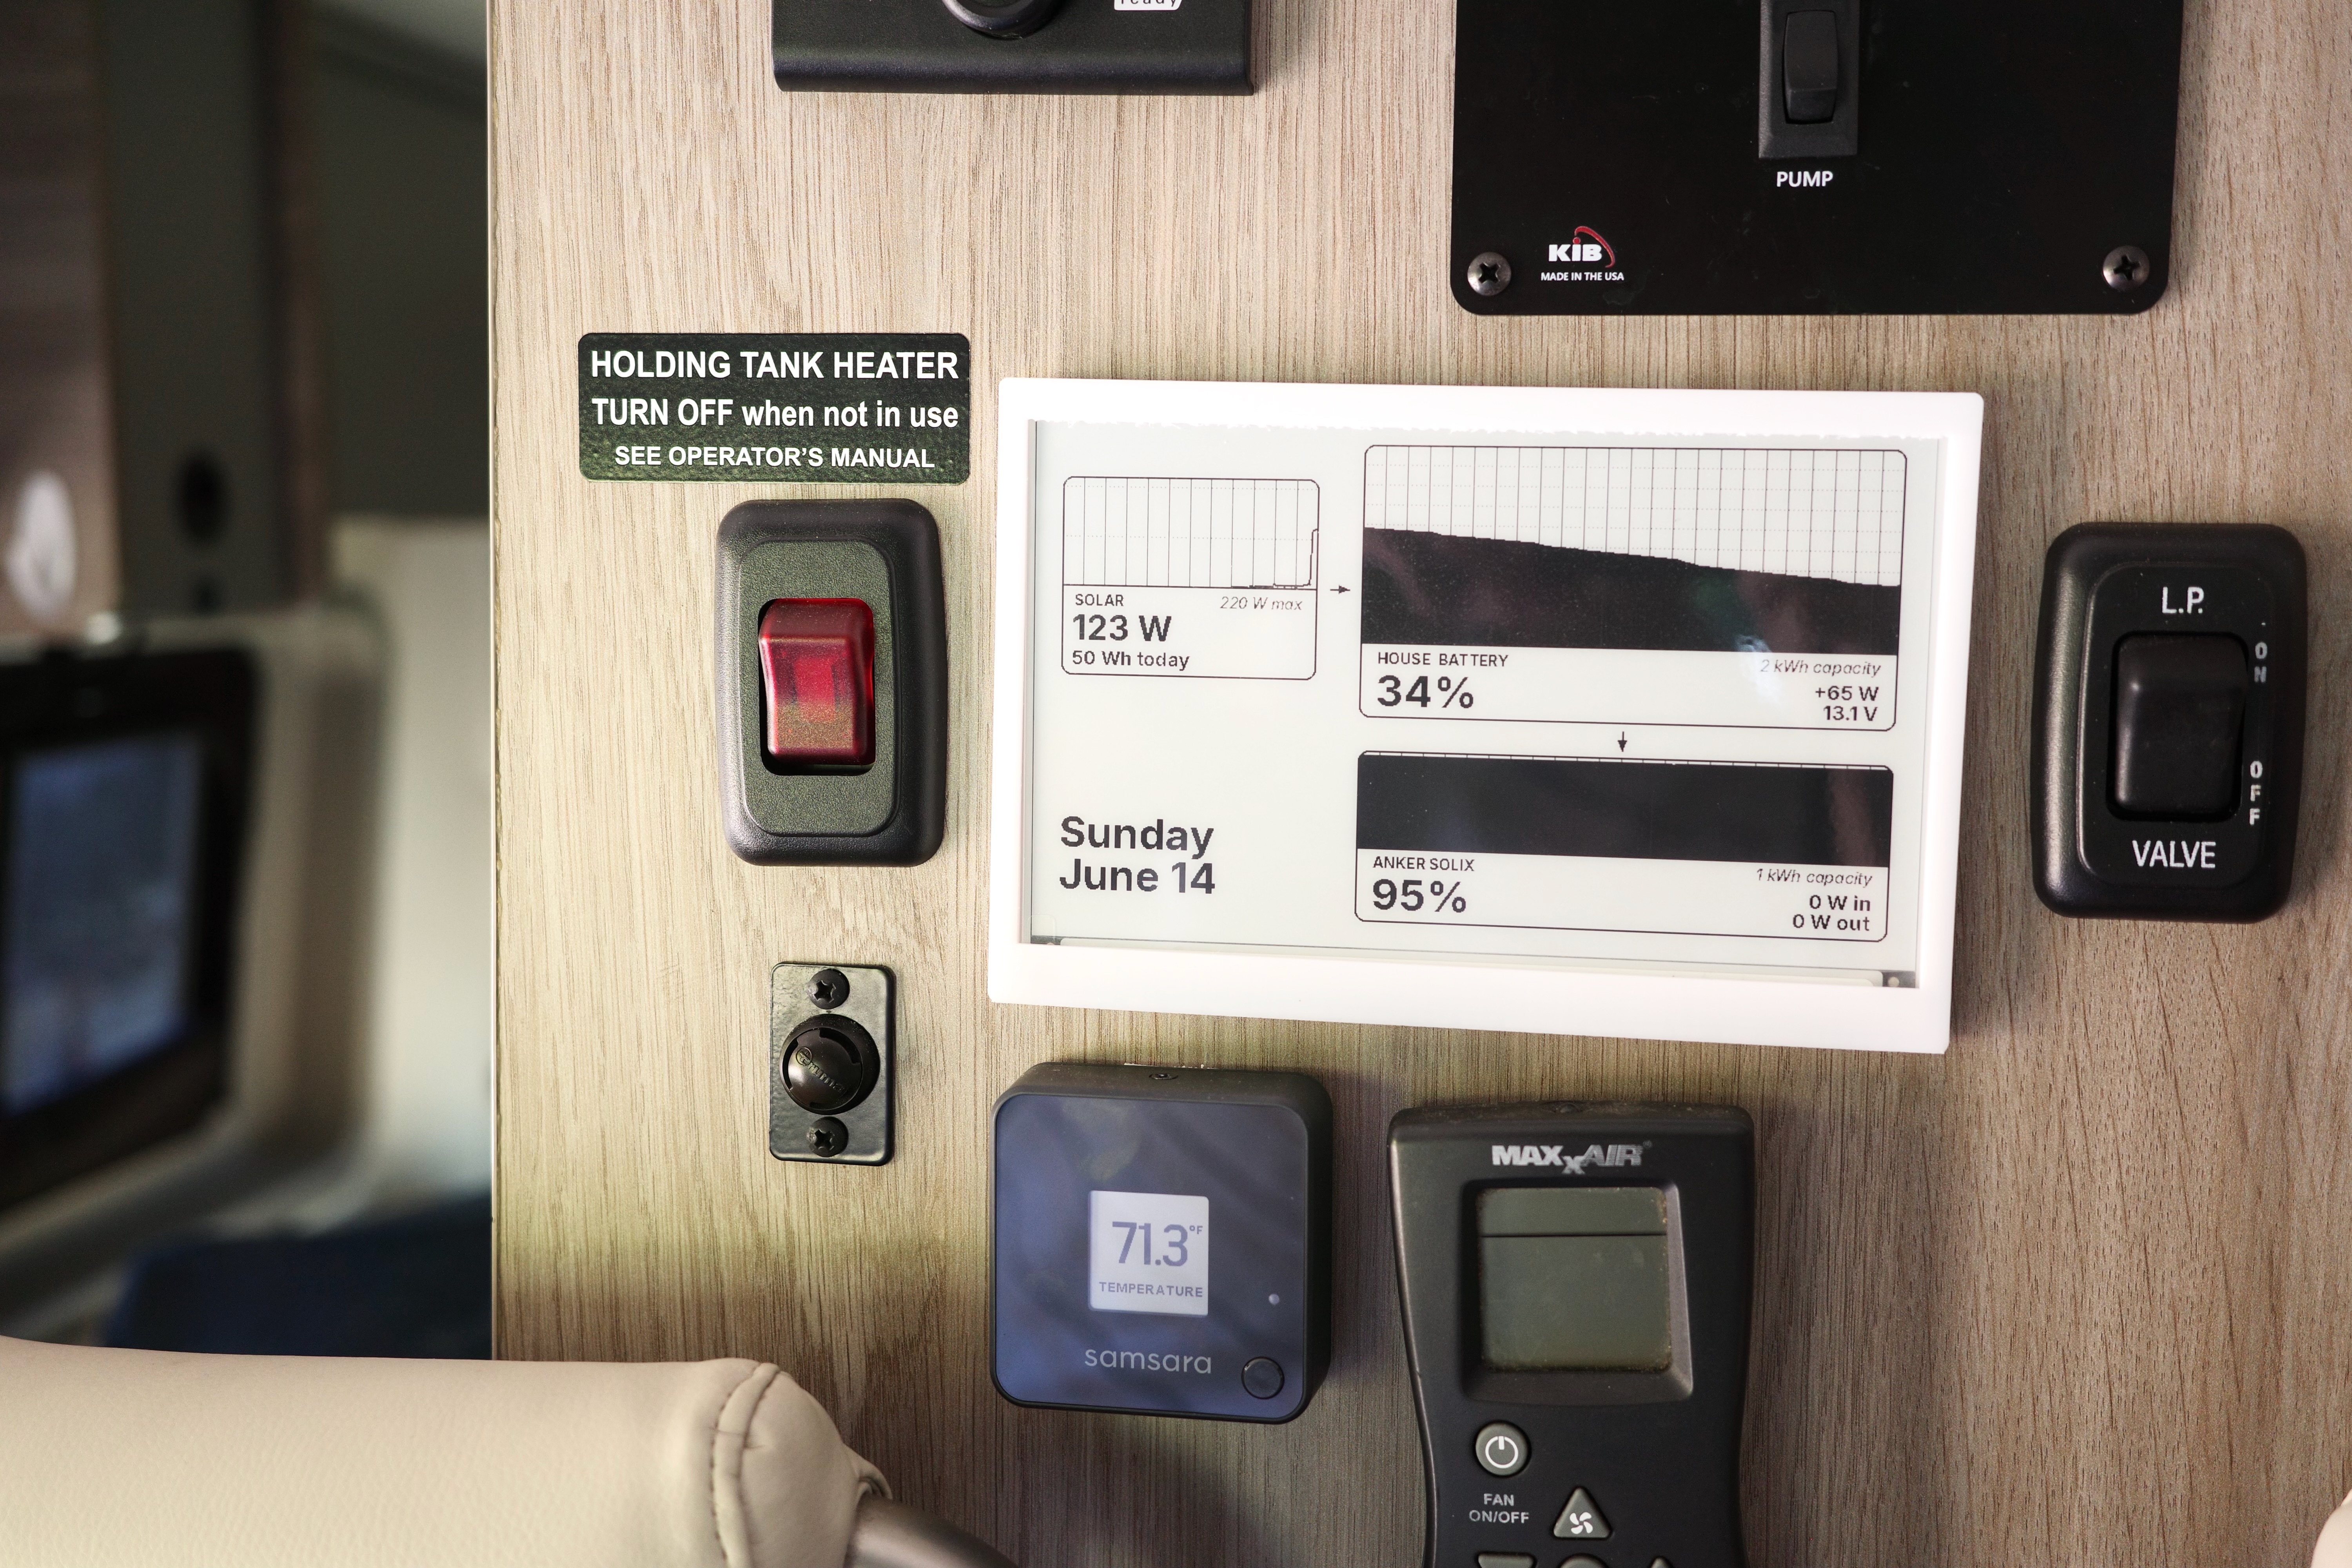
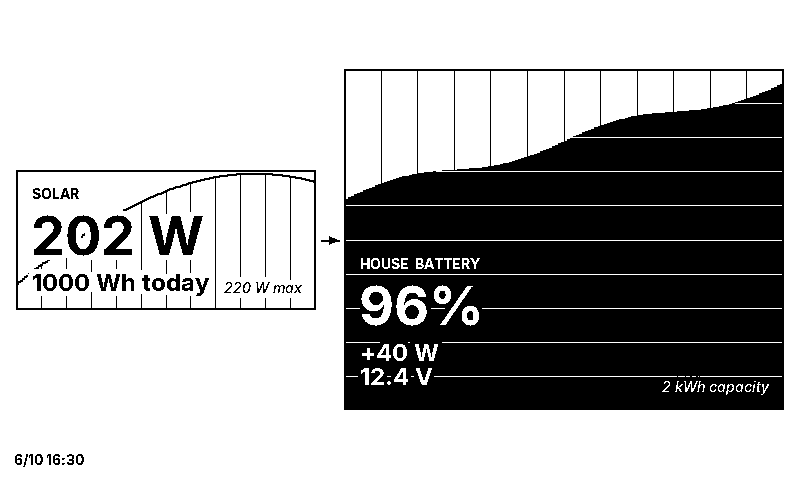
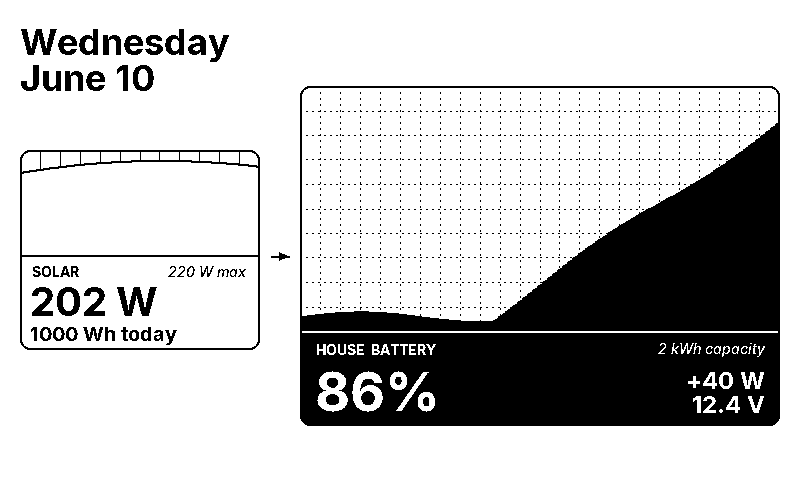
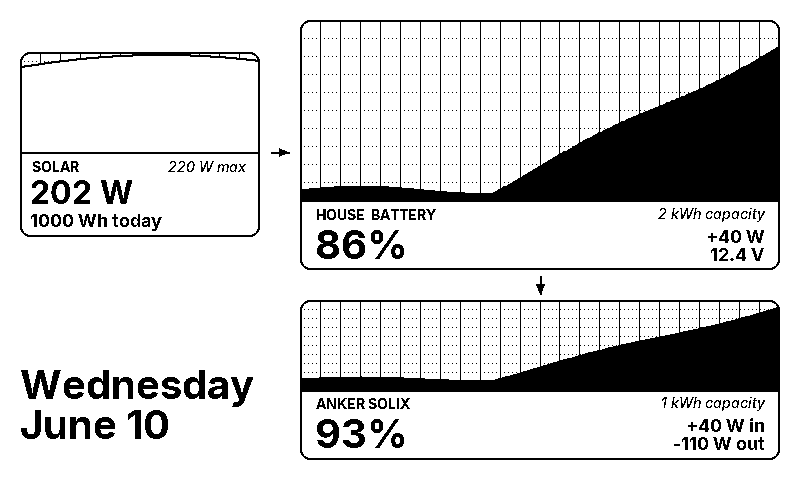
I wanted the graphic to intuitively represent how the system works. The arrows indicate the direction of energy flow between the devices, while the sizes of the filled-in areas correspond to the capacities of the two batteries—the house battery stores up to 2 kWh of energy, while the Anker power station stores 1 kWh, so the house battery chart is double the height of the Anker chart.
The charts show 24 hours of history for the batteries and 12 hours of history for the solar controller, so I can see at a glance how our energy stores have been increasing or decreasing over time.
Location
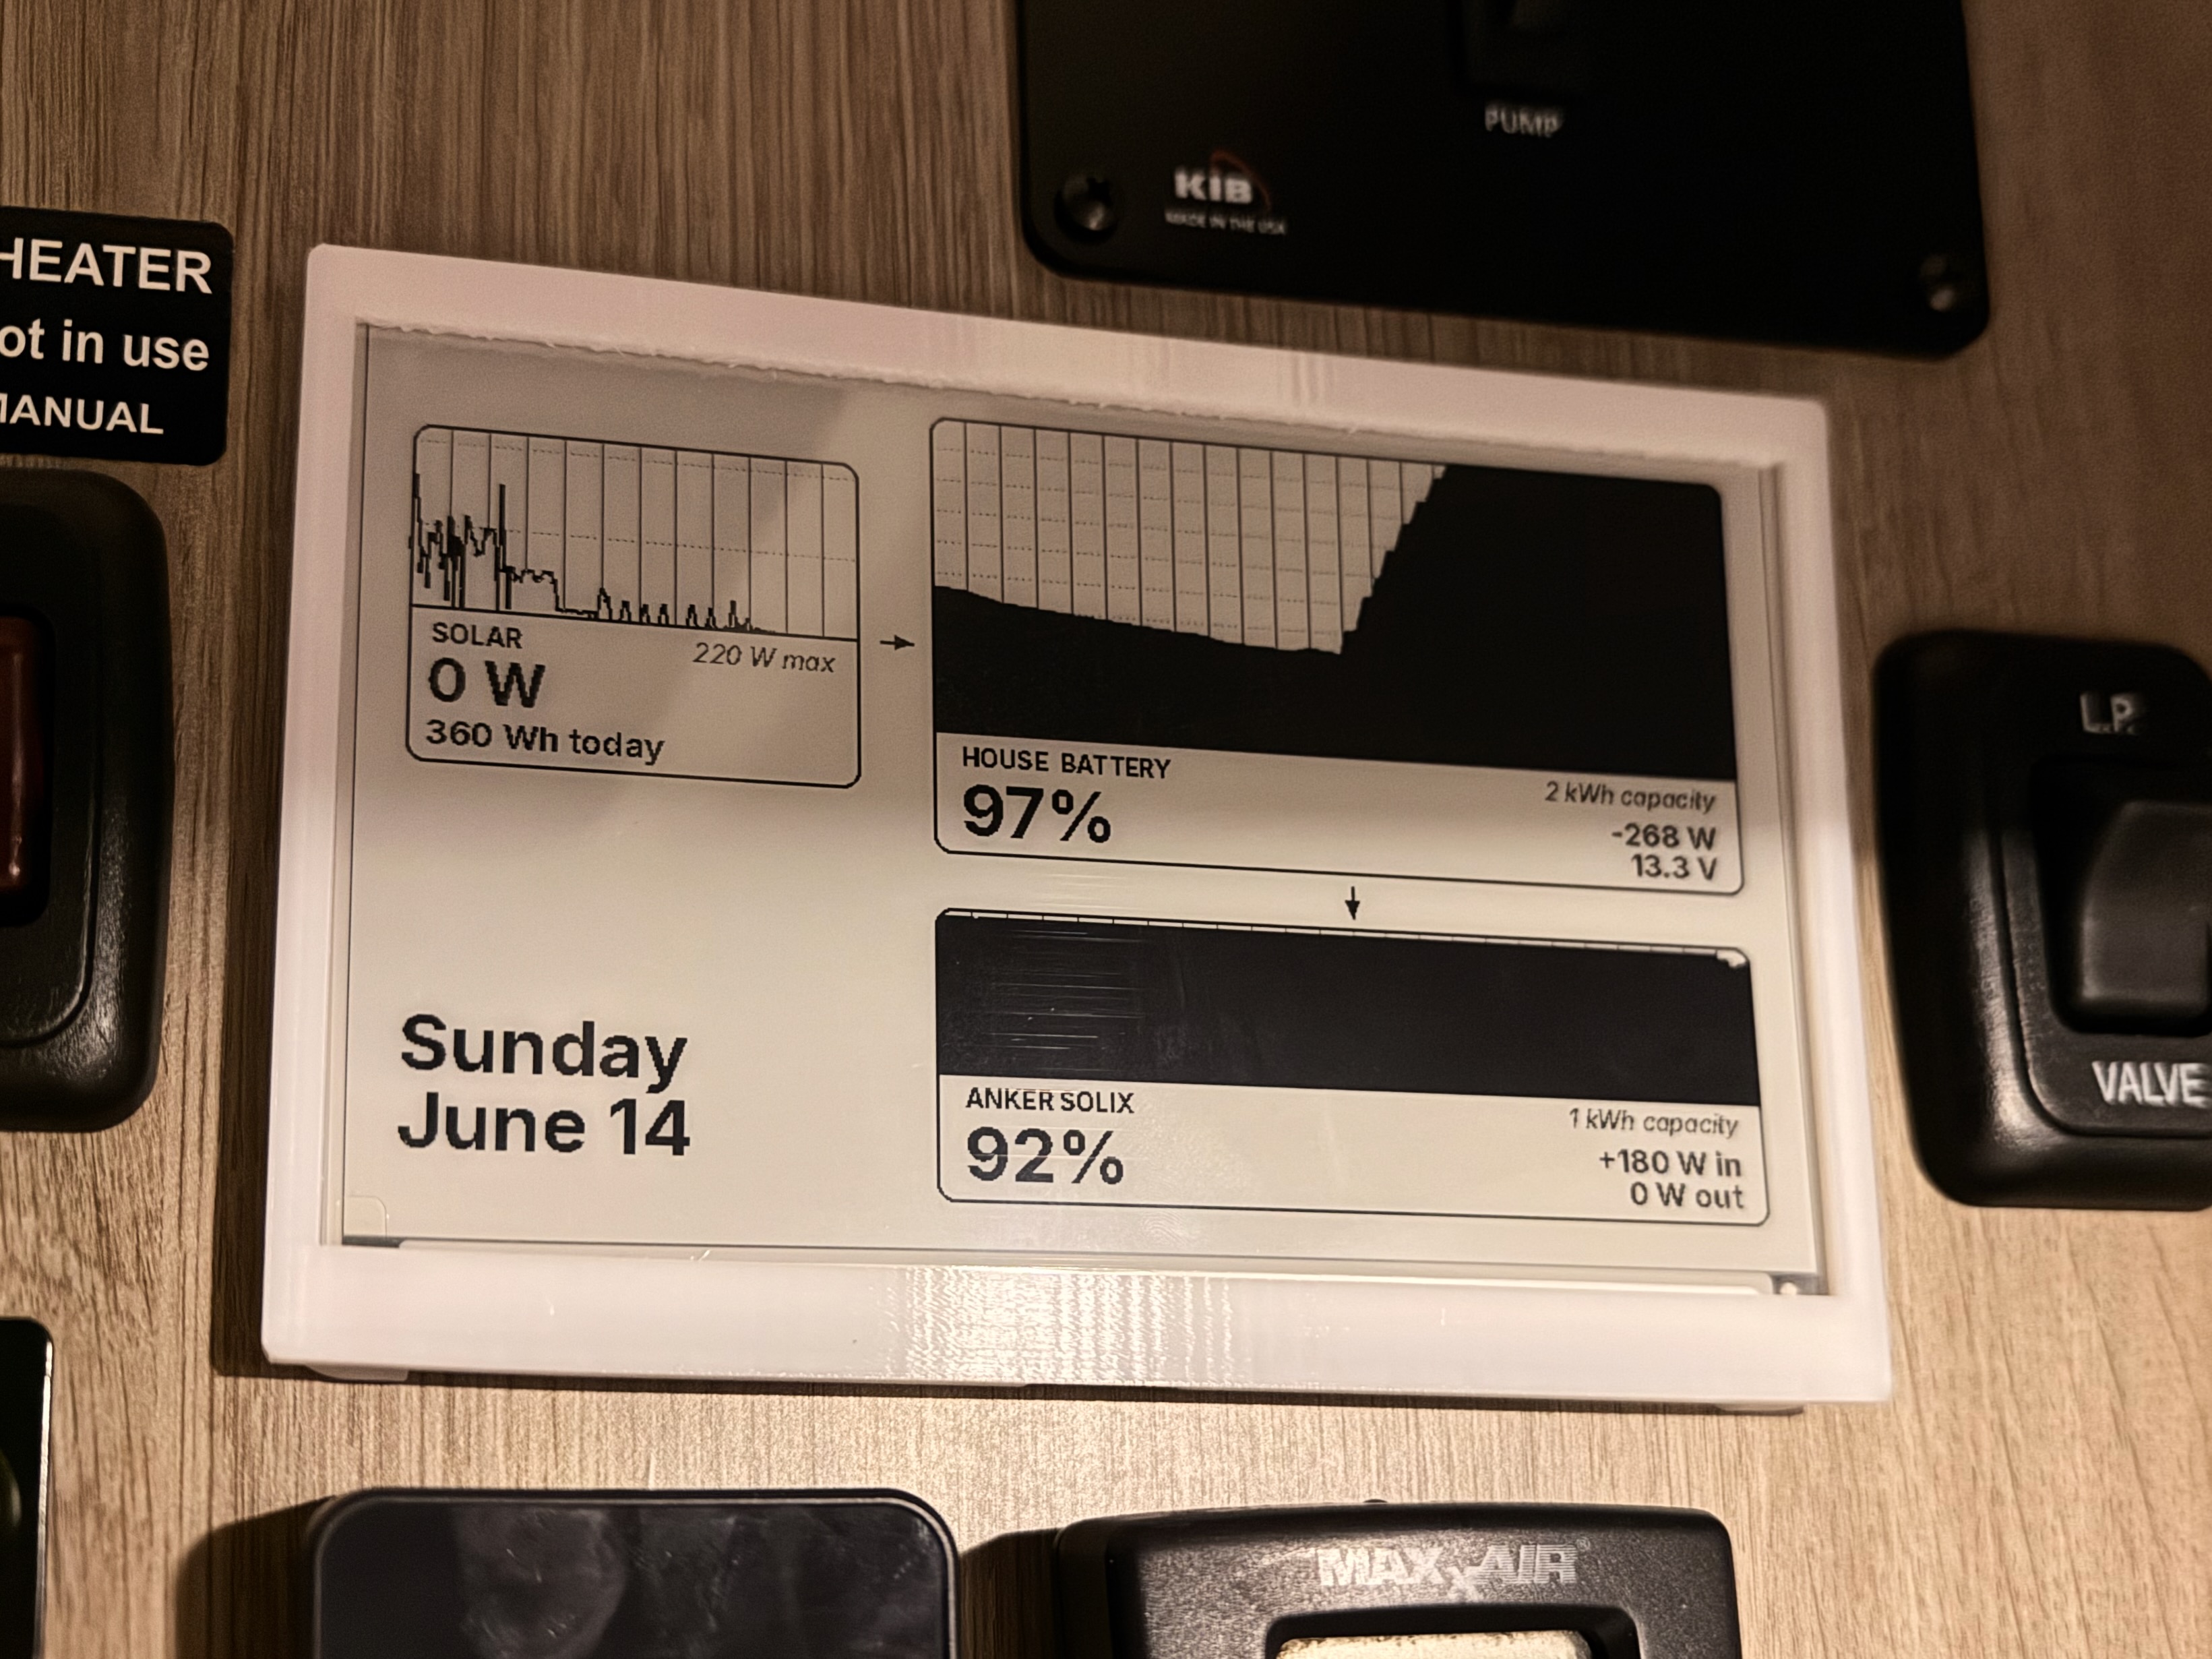
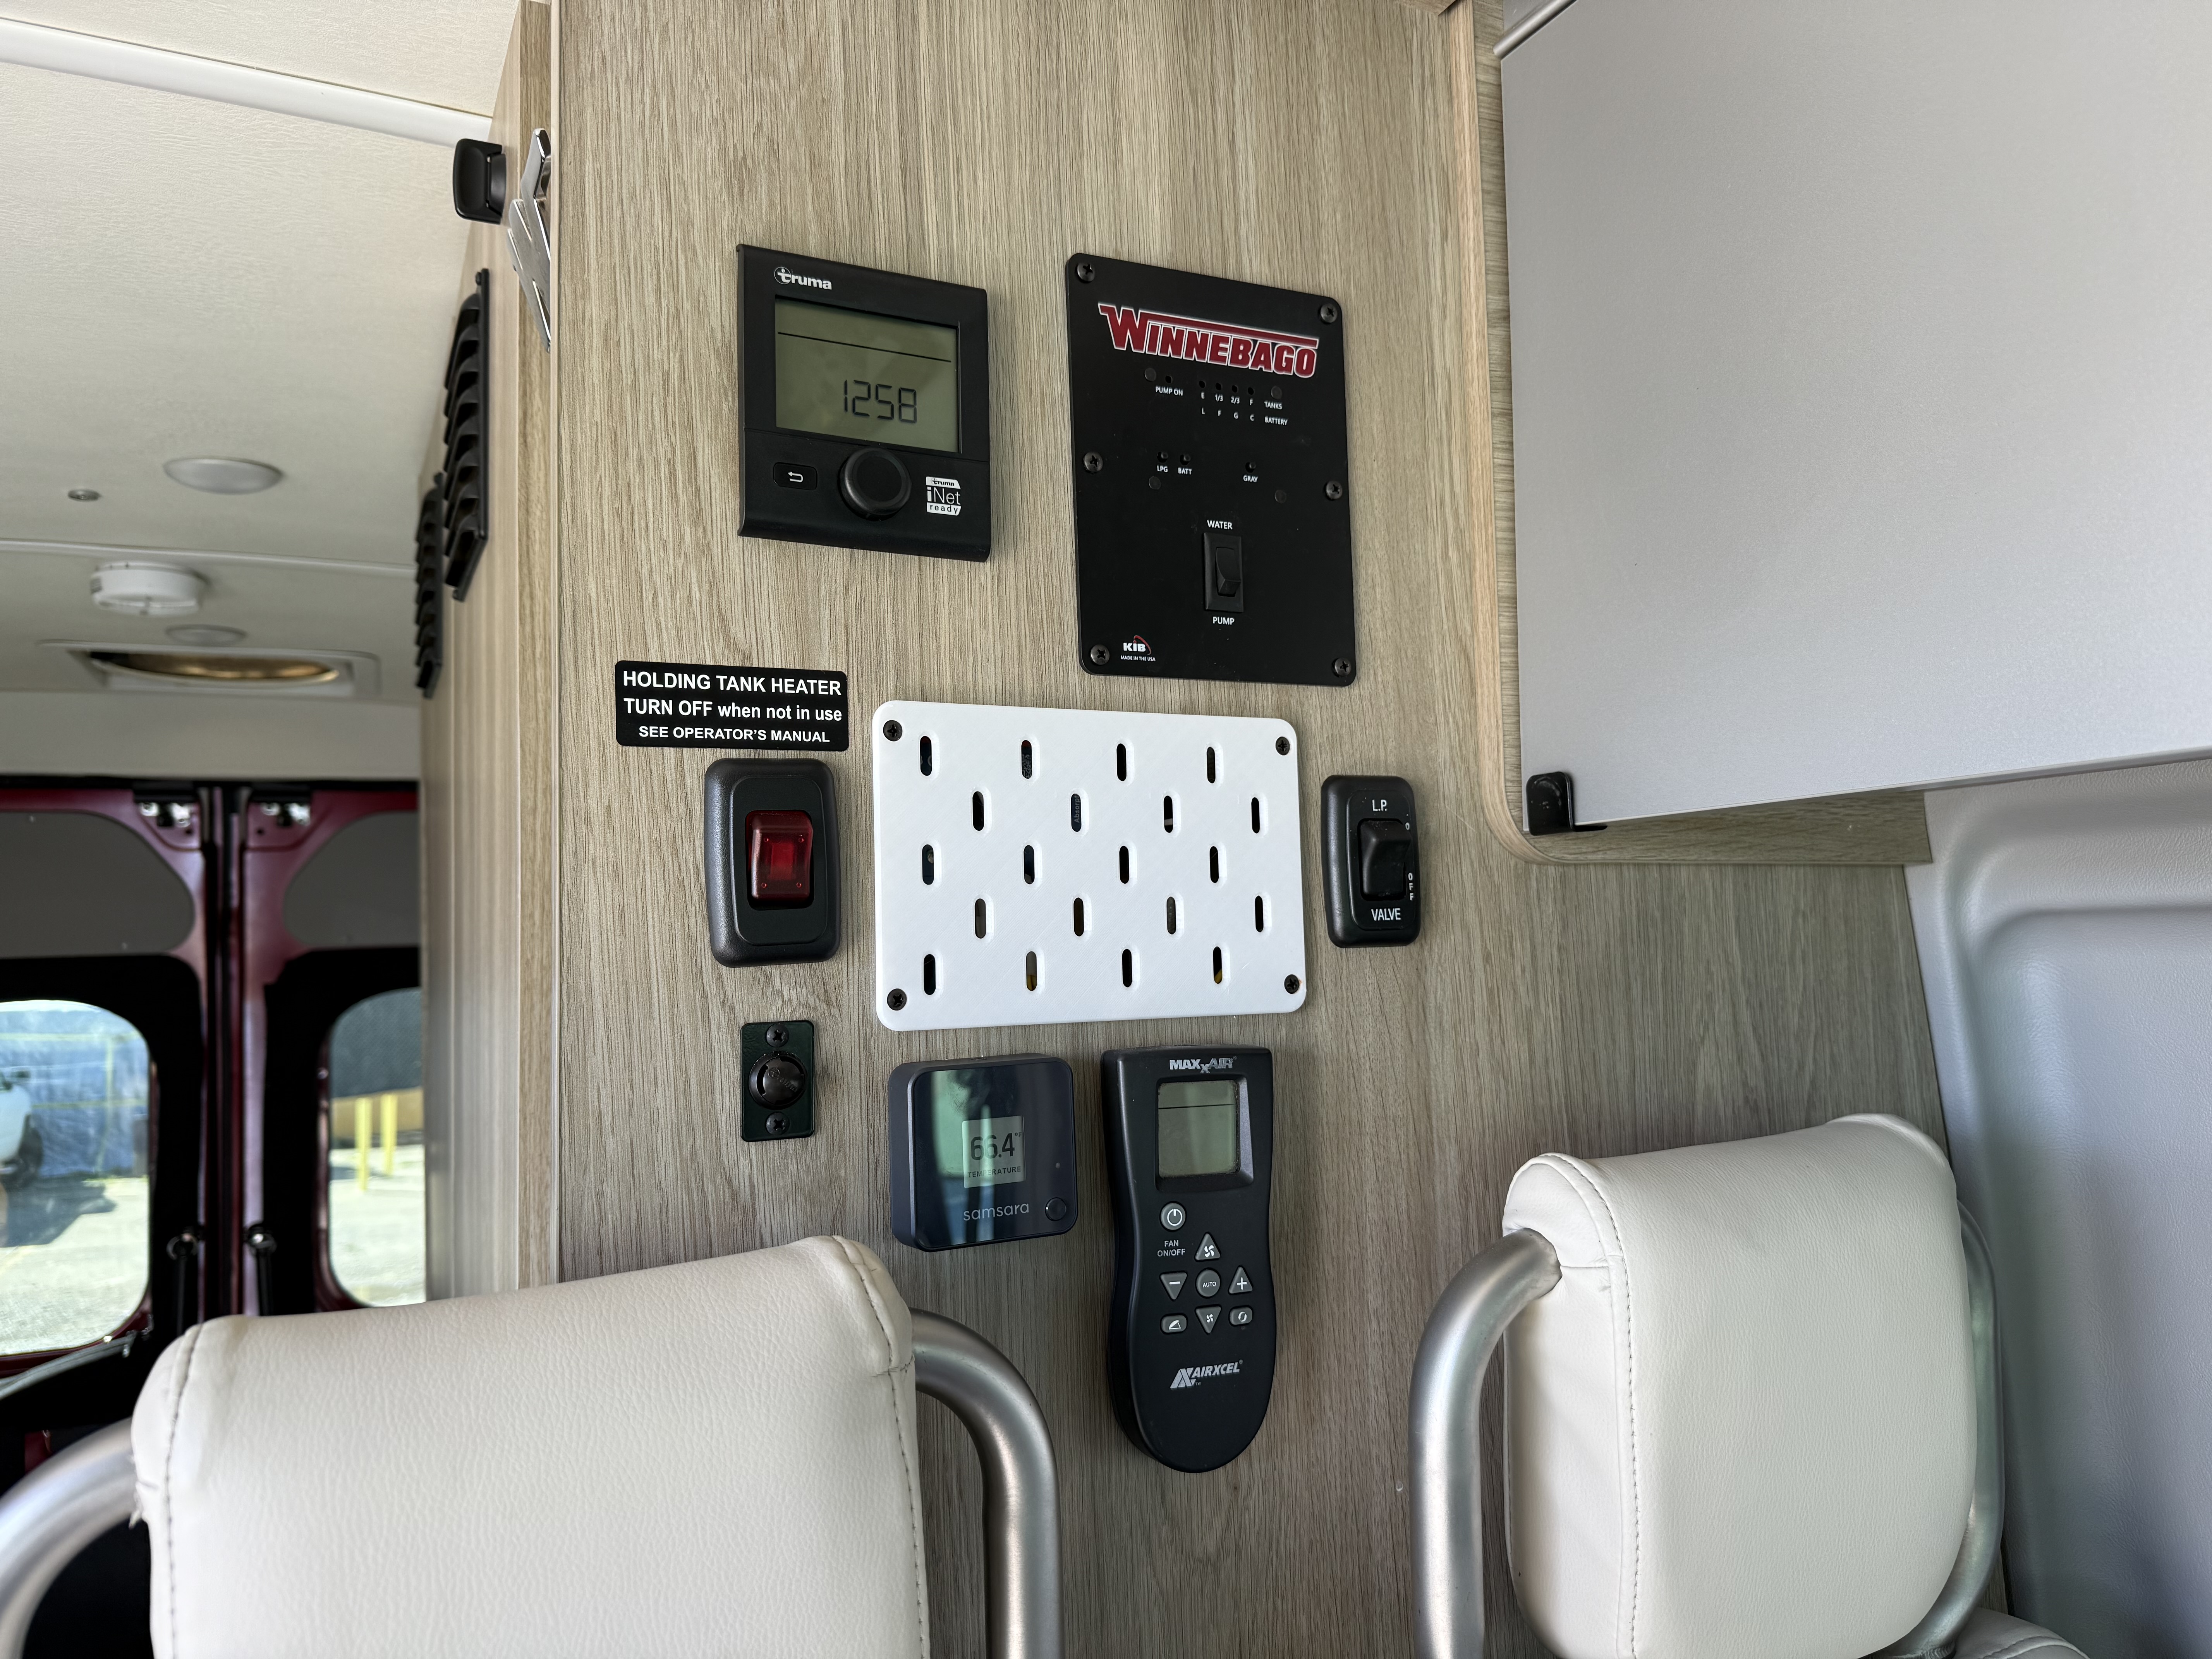
The display is located on the wall where the Winnebago Solis originally has a Xantrex solar controller. A few months ago, I replaced our van's Xantrex solar controller with a Victron MPPT unit. This left a hole in the wall which I then covered at the time with a 3D-printed IKEA Skadis pegboard:
Timeline
I worked on this project in my free time over a period of 2.5 weeks. Using AI for the software development shortened the timeline a lot. There are definitely still many rough edges (especially in the mounting of the hardware) but overall I'm pretty happy with how it currently looks and functions.
Hardware design and philosophy
My goal was to create an end product that would be quietly and calmly informative, to allow Sharlene and me to disconnect, relax, and enjoy our camper van to the fullest.
To this end, I decided that there would be no user input—no touchscreen, no buttons, no nothing. I wanted interacting with this display to be like looking at a wall clock. It should inform while asking nothing.
This design direction also led me to the e-paper display. Many dashboard display products like the Victron Ekrano GX use backlit, full-color LCD screens because they are readily available and very versatile. But I hate how these screens tend to shine brightly, especially in dark environments. They practically shout and demand attention. Our world is filled with way too many bright LCD screens already, and I'm a little bit sick and tired of them.
I much prefer how visually quiet e-paper is. It still conveys information clearly, but fades into the background when you aren't paying attention to it. I still have my e-paper fog display hanging on our living room wall, and I love looking at it every day.
The e-paper display I chose supports partial refresh, so it can quietly update without flashing the whole screen black and white. Watching the numbers update on this display feels a little bit like magic.
Hardware development
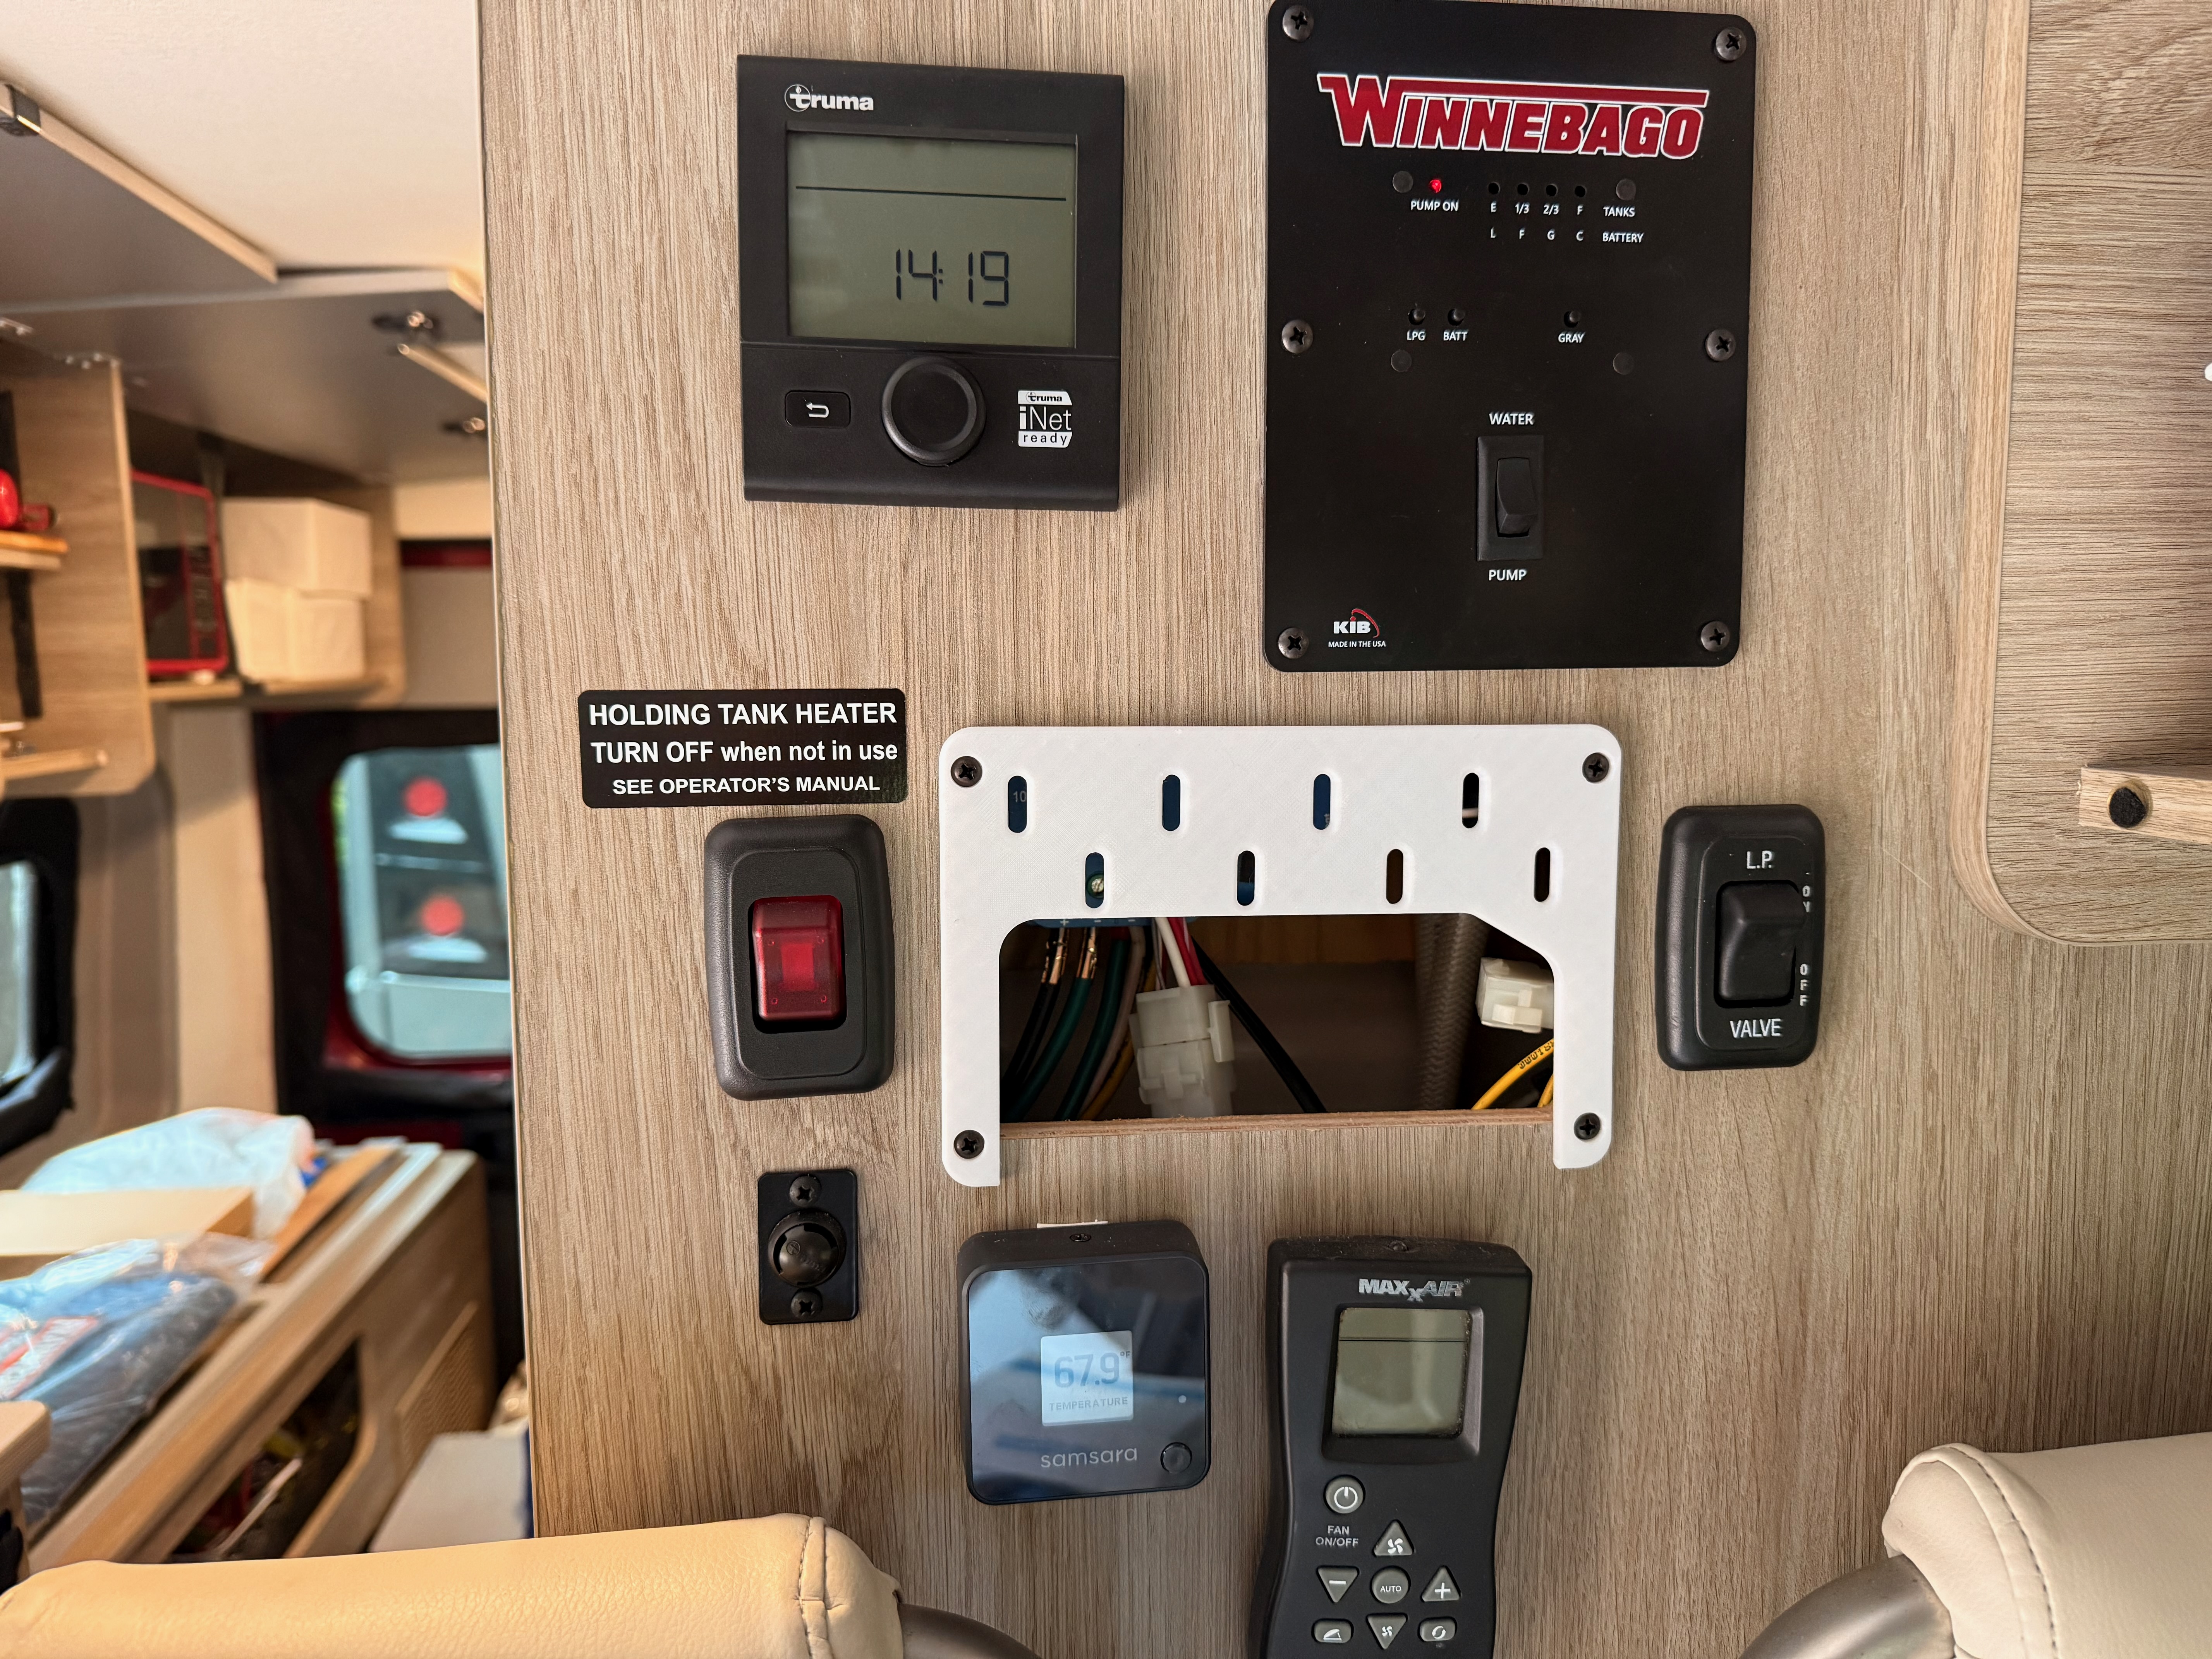
The mounting for the display is all 3D-printed. It consists of a partial IKEA Skadis-compatible pegboard, which is screwed into the van wall using the holes from the original Xantrex solar controller. Then, the display frame hooks into the pegboard.
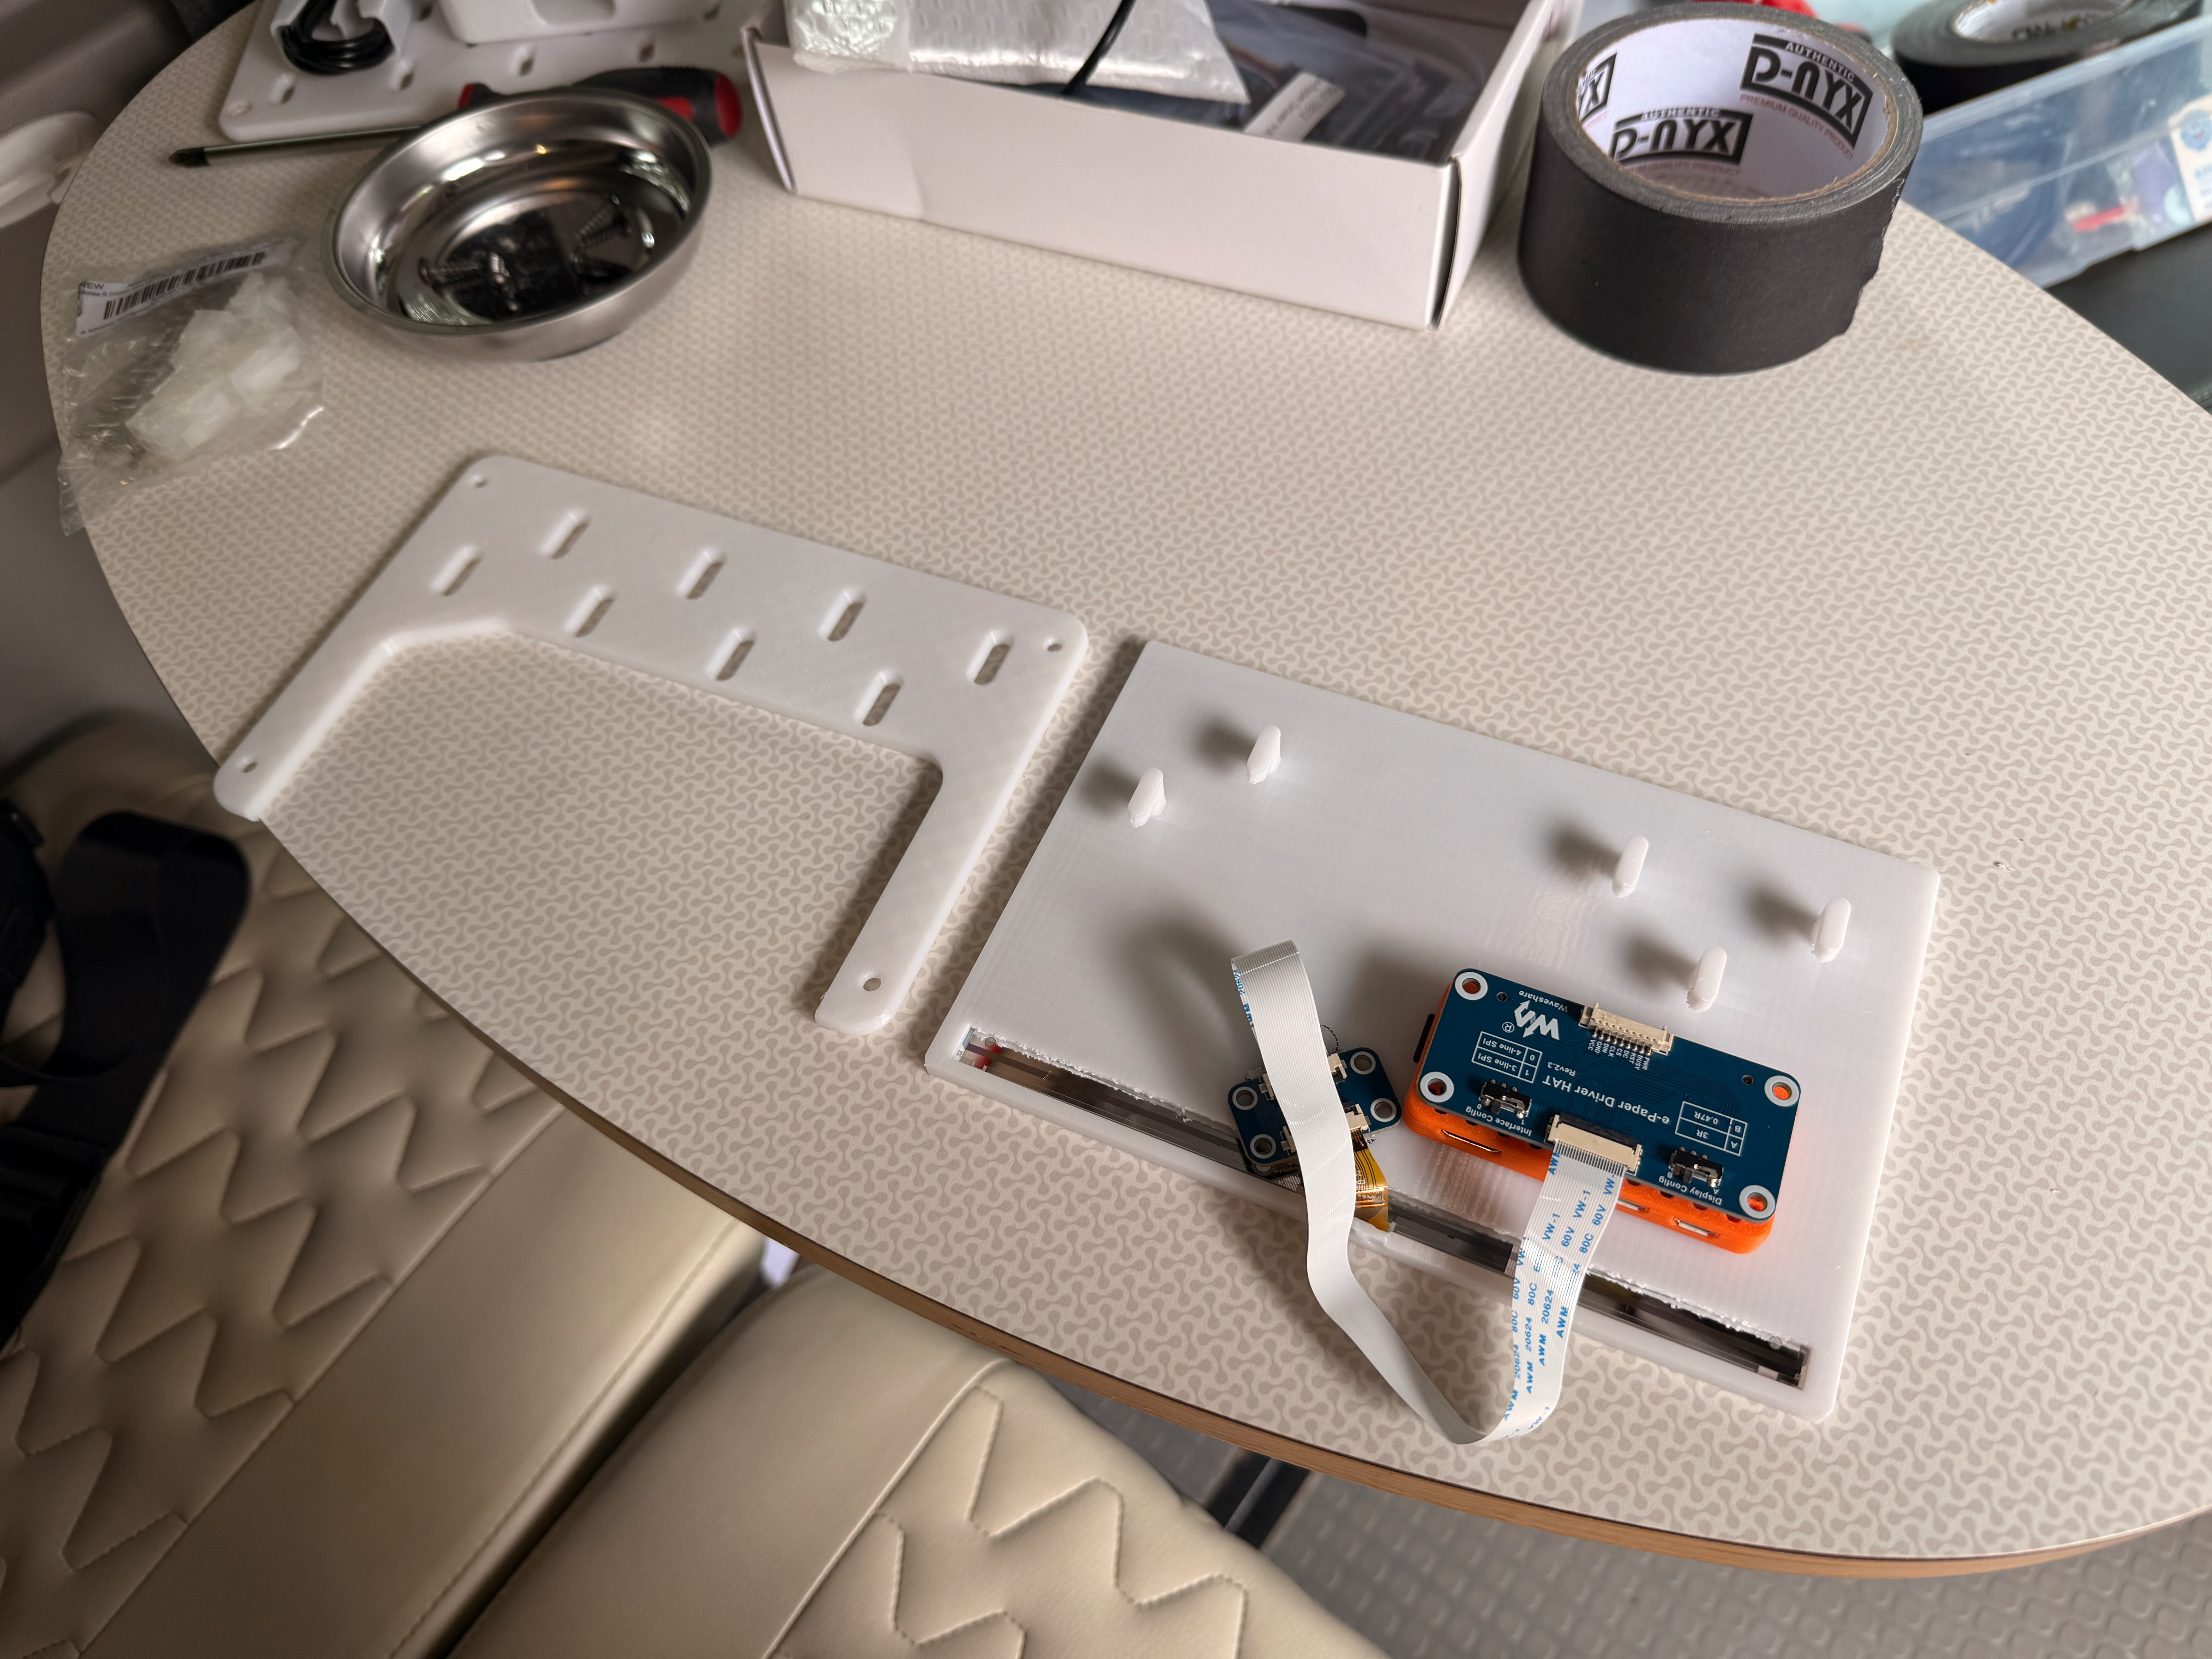
I really sped through the design of the enclosure and mounting. We had some unexpected last-minute travel, which meant I didn't have much time at home to do multiple rounds of printing and refinement. So I optimized for the easiest solution that would function on the first try, which led me to modifying existing models I found online.
My CAD model can be found on OnShape here. The display frame is derived from this design by dgurkaynak, and the pegboard is derived from this design by AU3D.
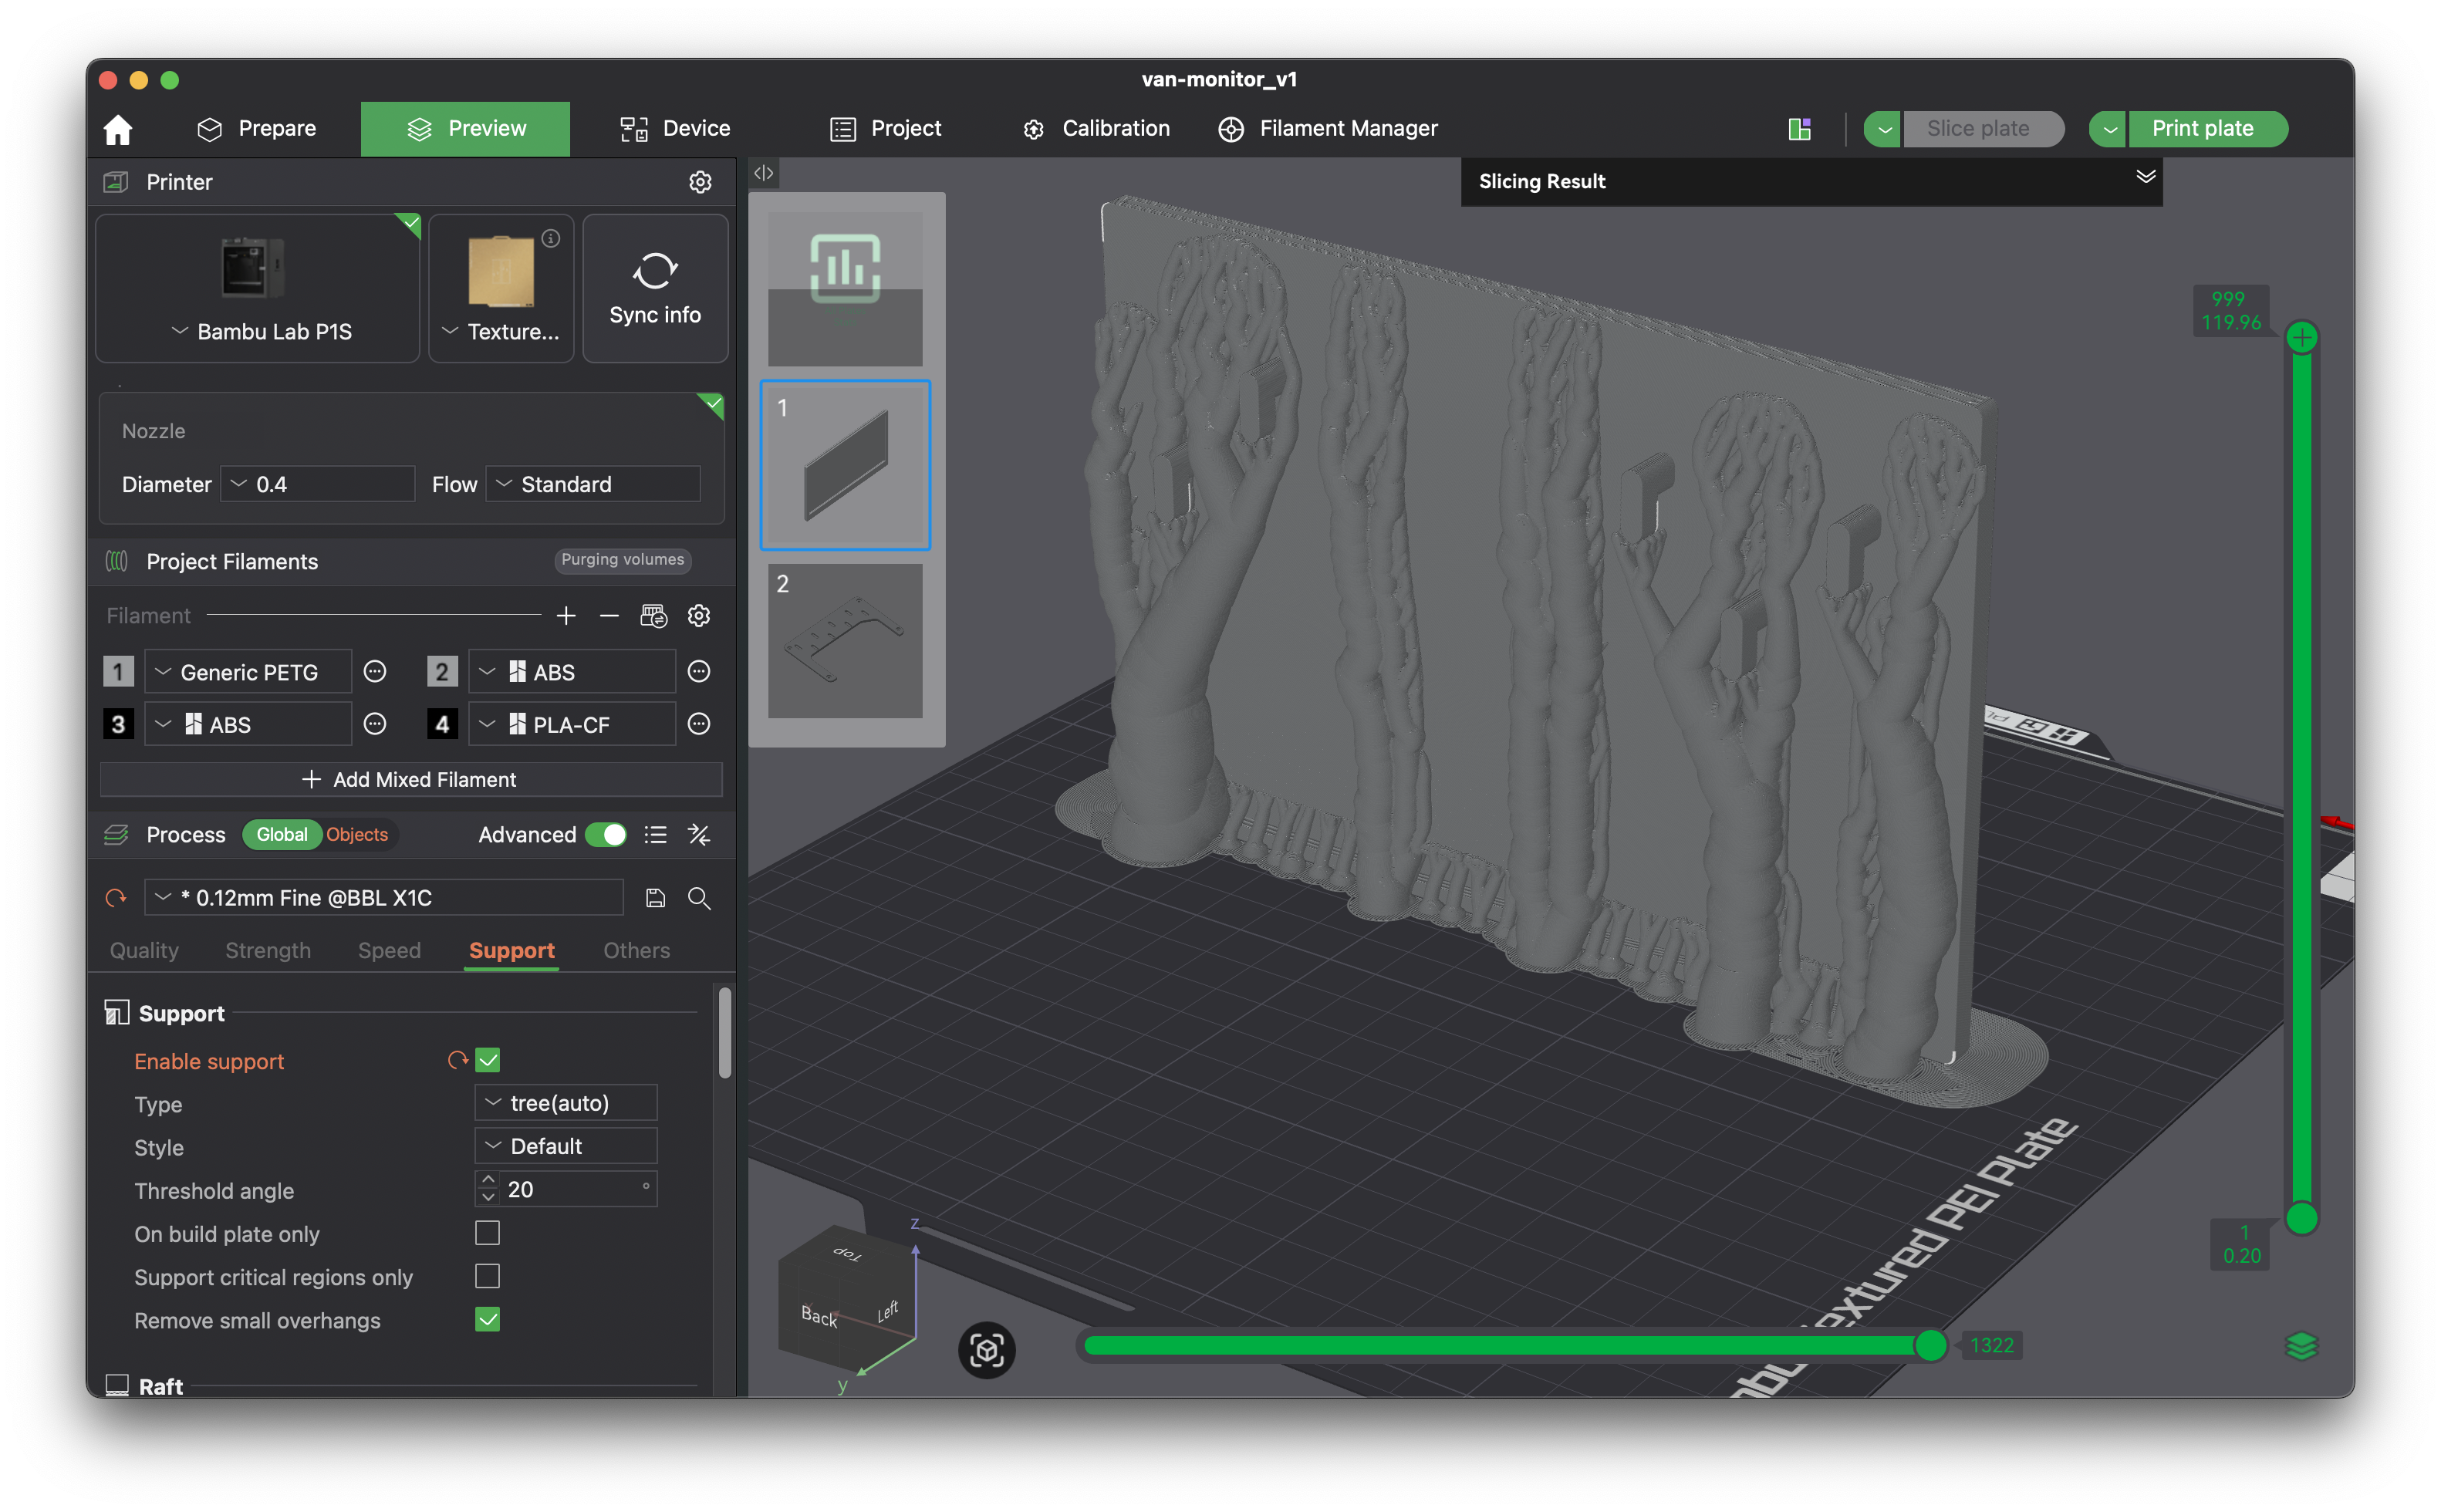
Printing was a little bit of a challenge because the frame is so tall and thin. I chose to print upright, and my first print failed because the part detached from the print bed. On my second try, I added a bunch of extra manually-painted supports to the vertical walls, which worked well.
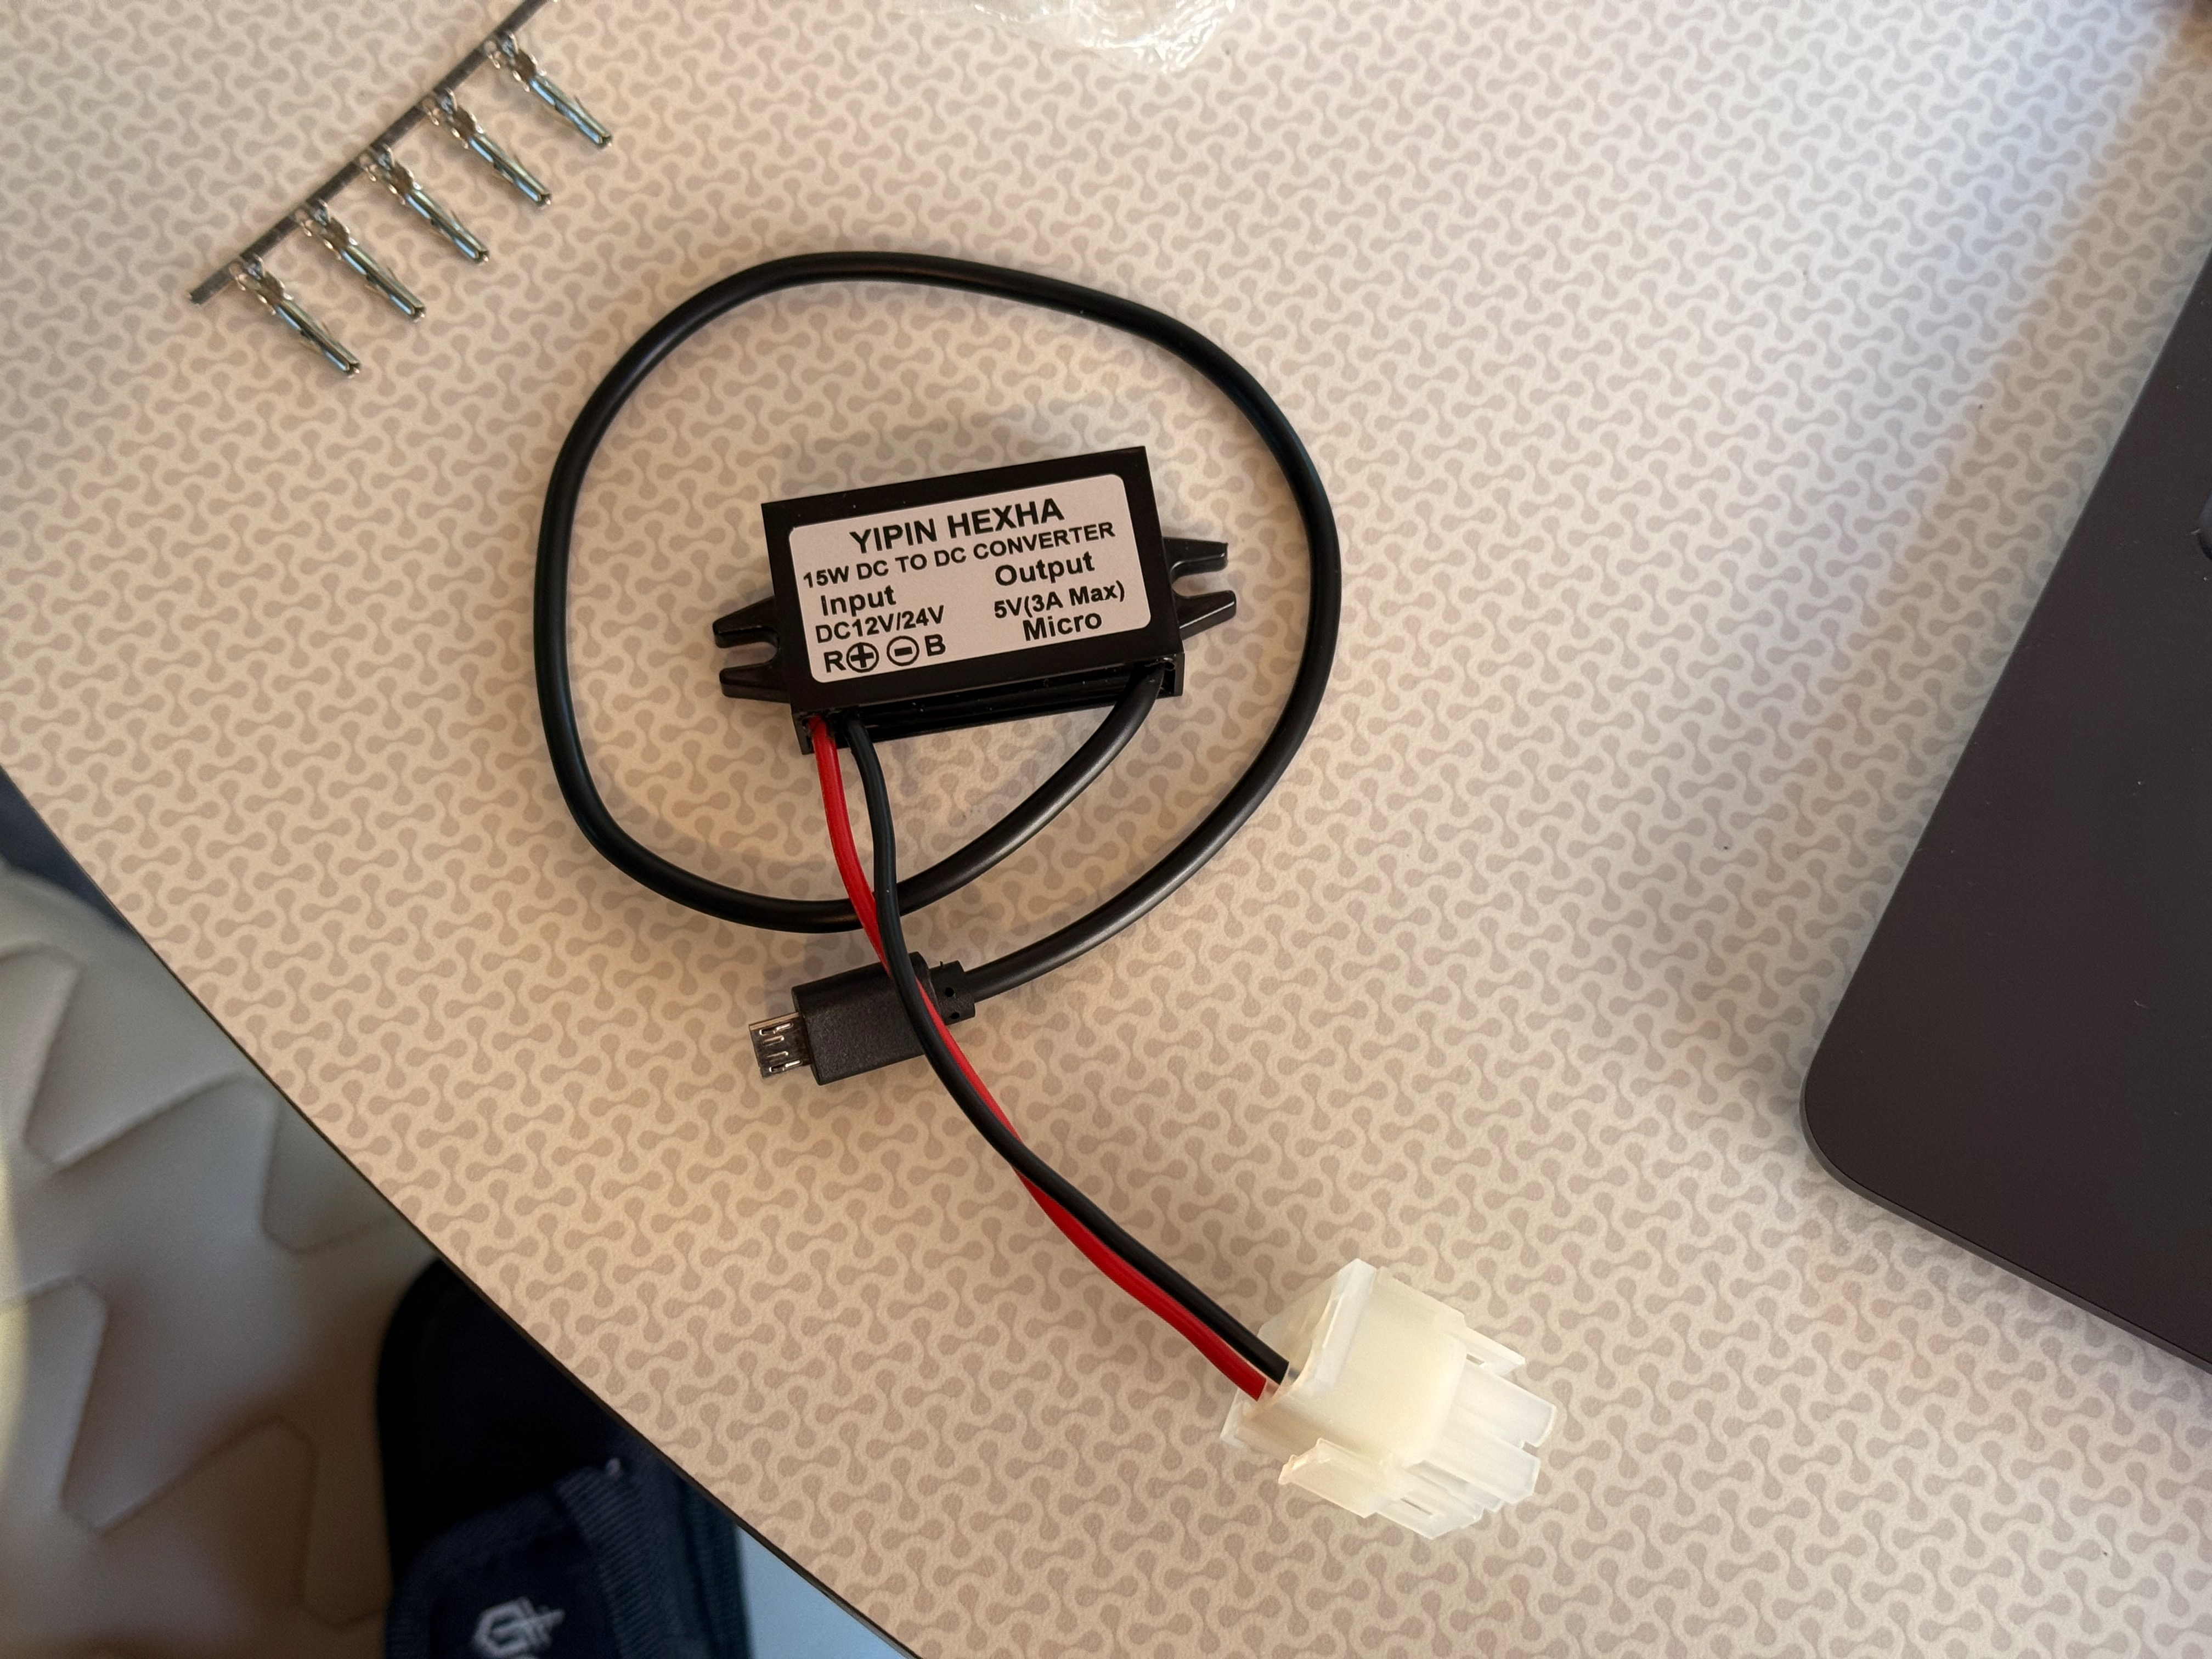
Power comes from an unused 6-pin Molex connector that had been left available by Winnebago in the wall cavity wiring. I connected the 12 V power present at that connector to a voltage converter to get 5 V for the Raspberry Pi.
The Raspberry Pi is protected by a separate enclosure designed by VINCLER. I didn't have time to design a proper mount for the Raspberry Pi or the voltage converter, so they are just attached with gaffer's tape to the backside of the wall. Not very elegant, but at least it's held up so far over about 800 miles of driving.
Bill of materials
The parts list for this project was very simple. Most of the cost is in the e-paper display.
| Item | Link | Cost |
|---|---|---|
| Waveshare 7.5" e-paper display HAT | Amazon | $73 |
| Raspberry Pi Zero WH | Micro Center | $16 |
| 12 V to 5 V MicroUSB power supply | Amazon | $9 |
| Molex 6-wire connector | Amazon | $6 |
| 8 GB MicroSD card | ||
| PETG filament for printed parts |
I had the MicroSD card and printer filament on hand already, so those aren't included in the BOM costs above.
Software development
My code can be found on Github here. It's mostly Python and relies on the existing libraries litime-ble, SolixBLE, and victron-ble.
More so than any of my previous projects, I leaned heavily on AI (specifically Cursor) to do the software development quickly. I basically initialized the repo, wrote a requirements doc, and asked the agent to build starting with a basic proof-of-concept. I liked how this let me focus on the more fun design aspects of the project, rather than the intricacies of the implementation. However, I also felt a lot more disconnected from the resulting code, and less confident making changes to the code on my own without AI help.
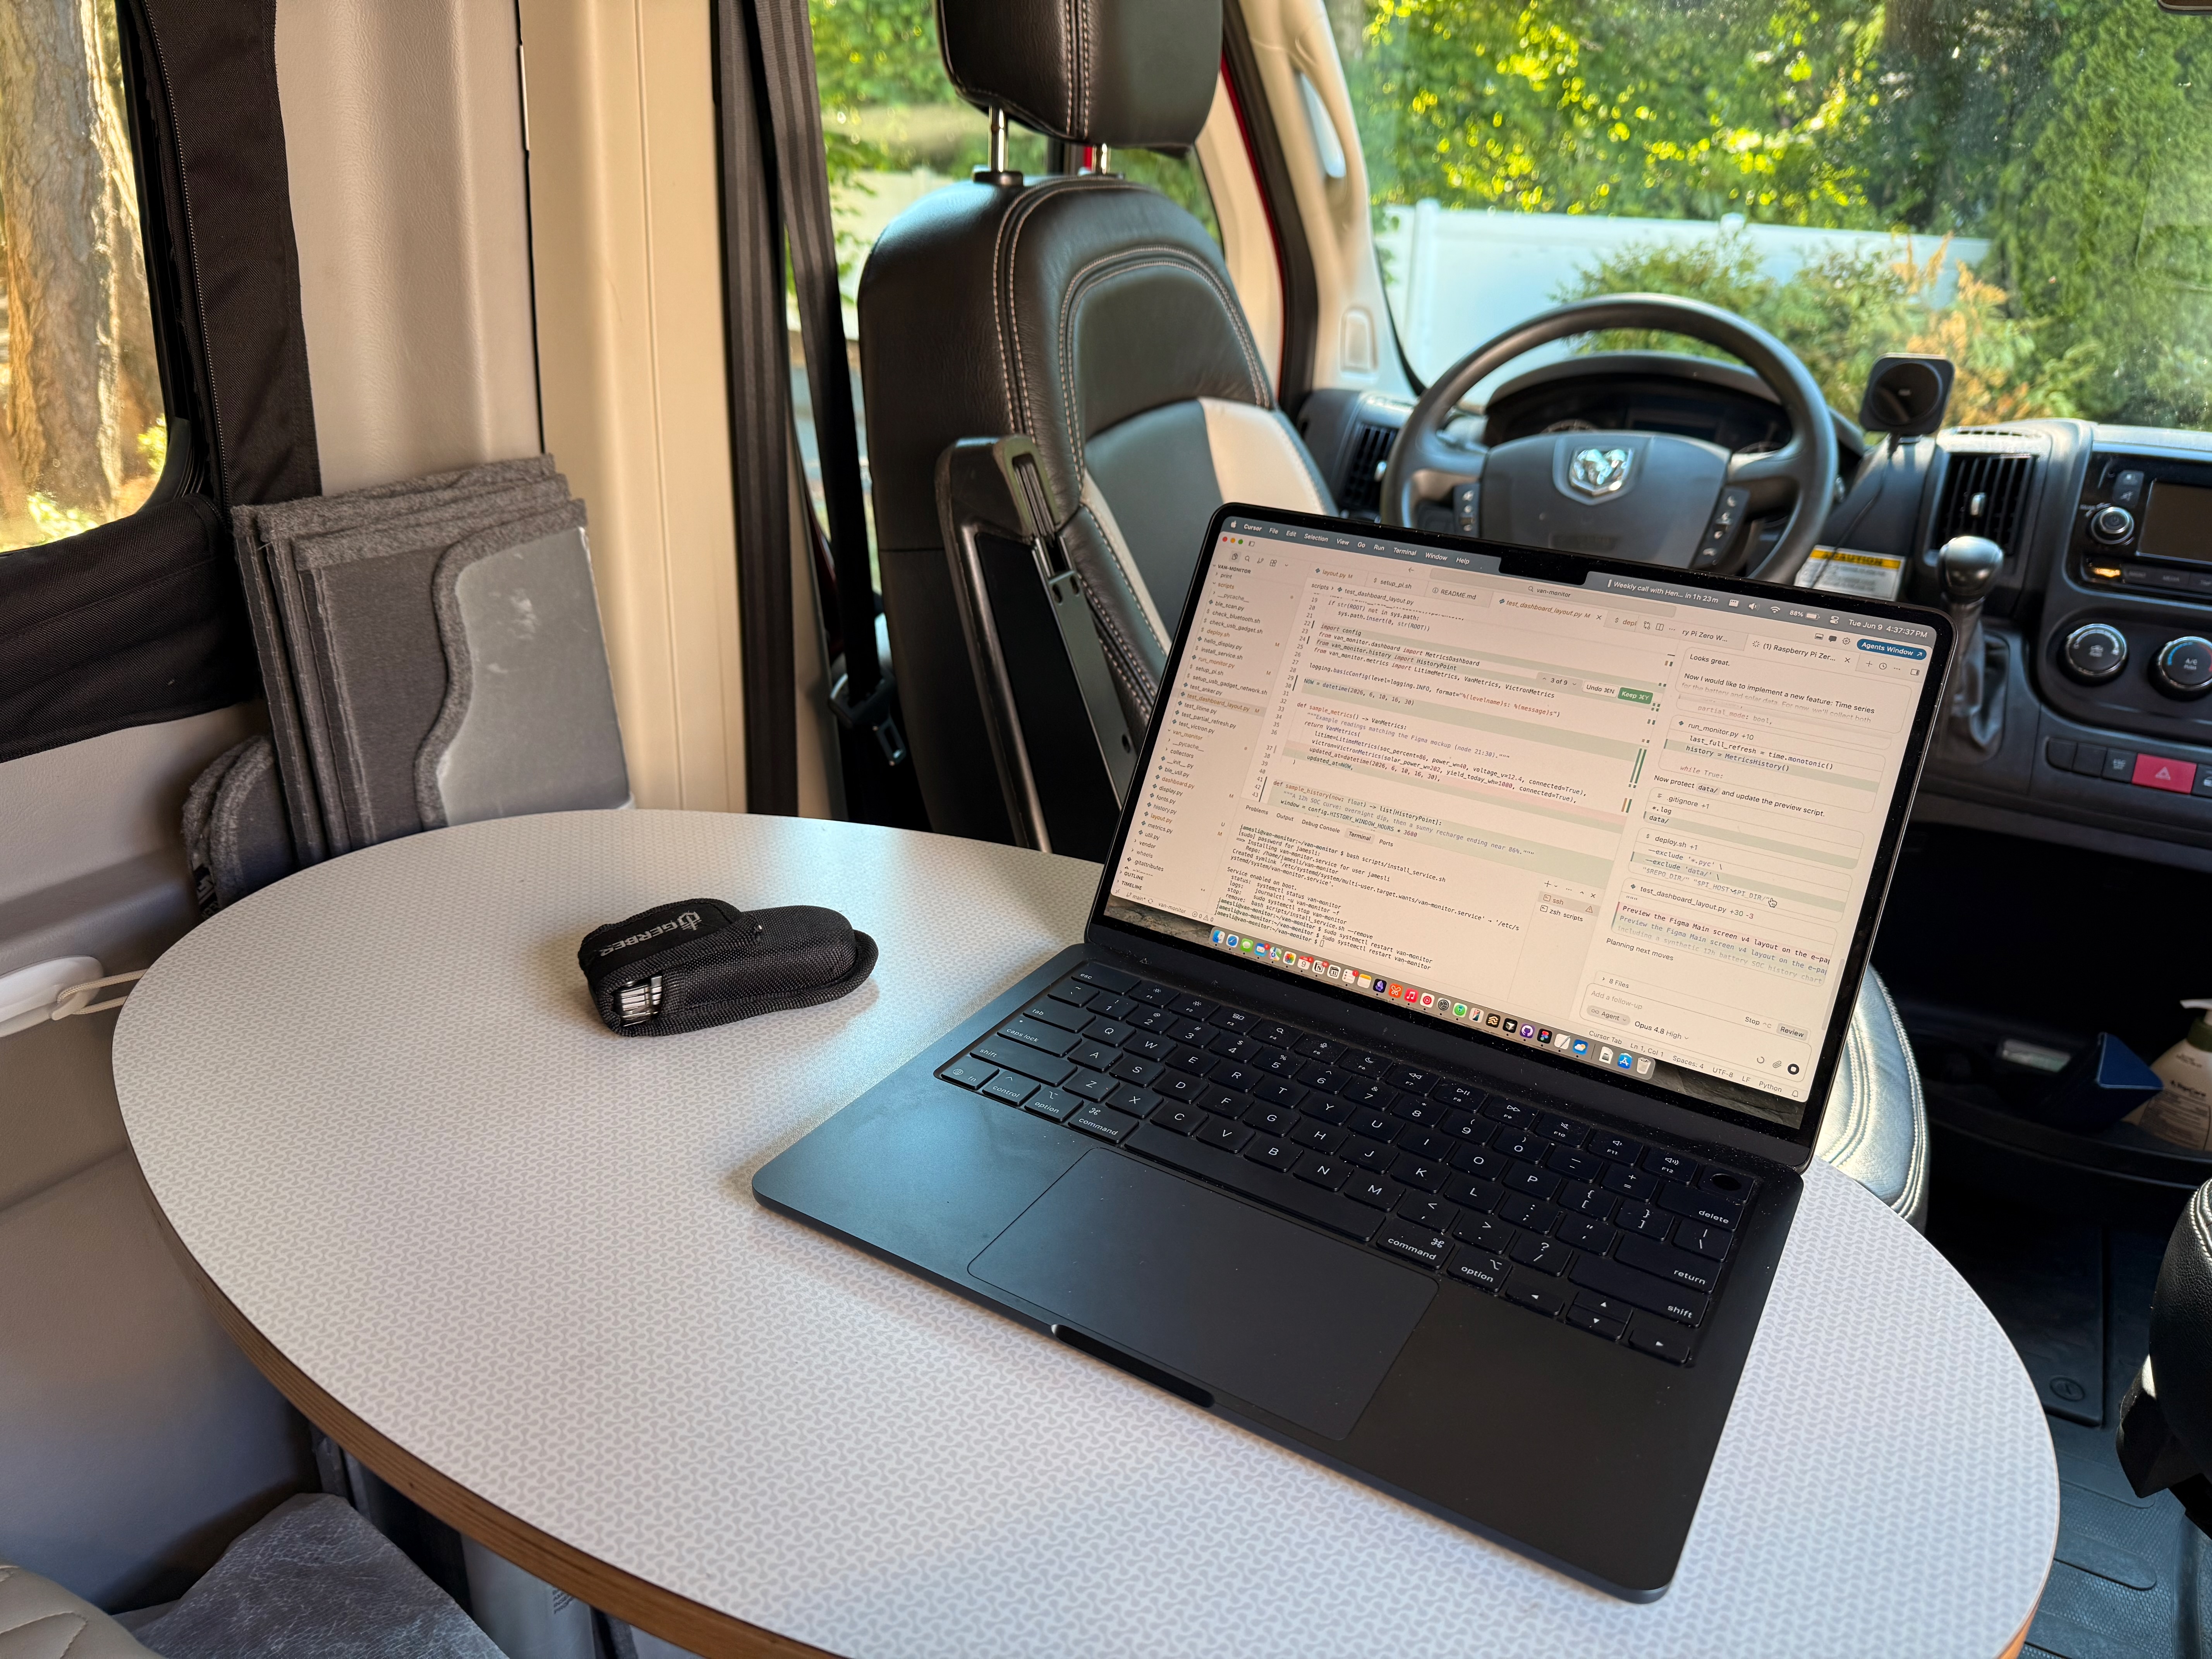
Developing in the field
A pretty annoying challenge was setting up a reliable dev environment. I chose to develop headless, and I didn't have a serial cable, so I needed a solid SSH connection to the Raspberry Pi. The van doesn't have its own wi-fi network, so I initially tried setting up SSH over USB. This worked briefly, but proved to be very shaky (maybe due to my MacBook's configuration, or maybe weirdness in my USB cable and hub). Thankfully, I ended up doing most of my development in the driveway of my friend Kathleen's place, where I was able to just SSH over her home wi-fi network.
UI design
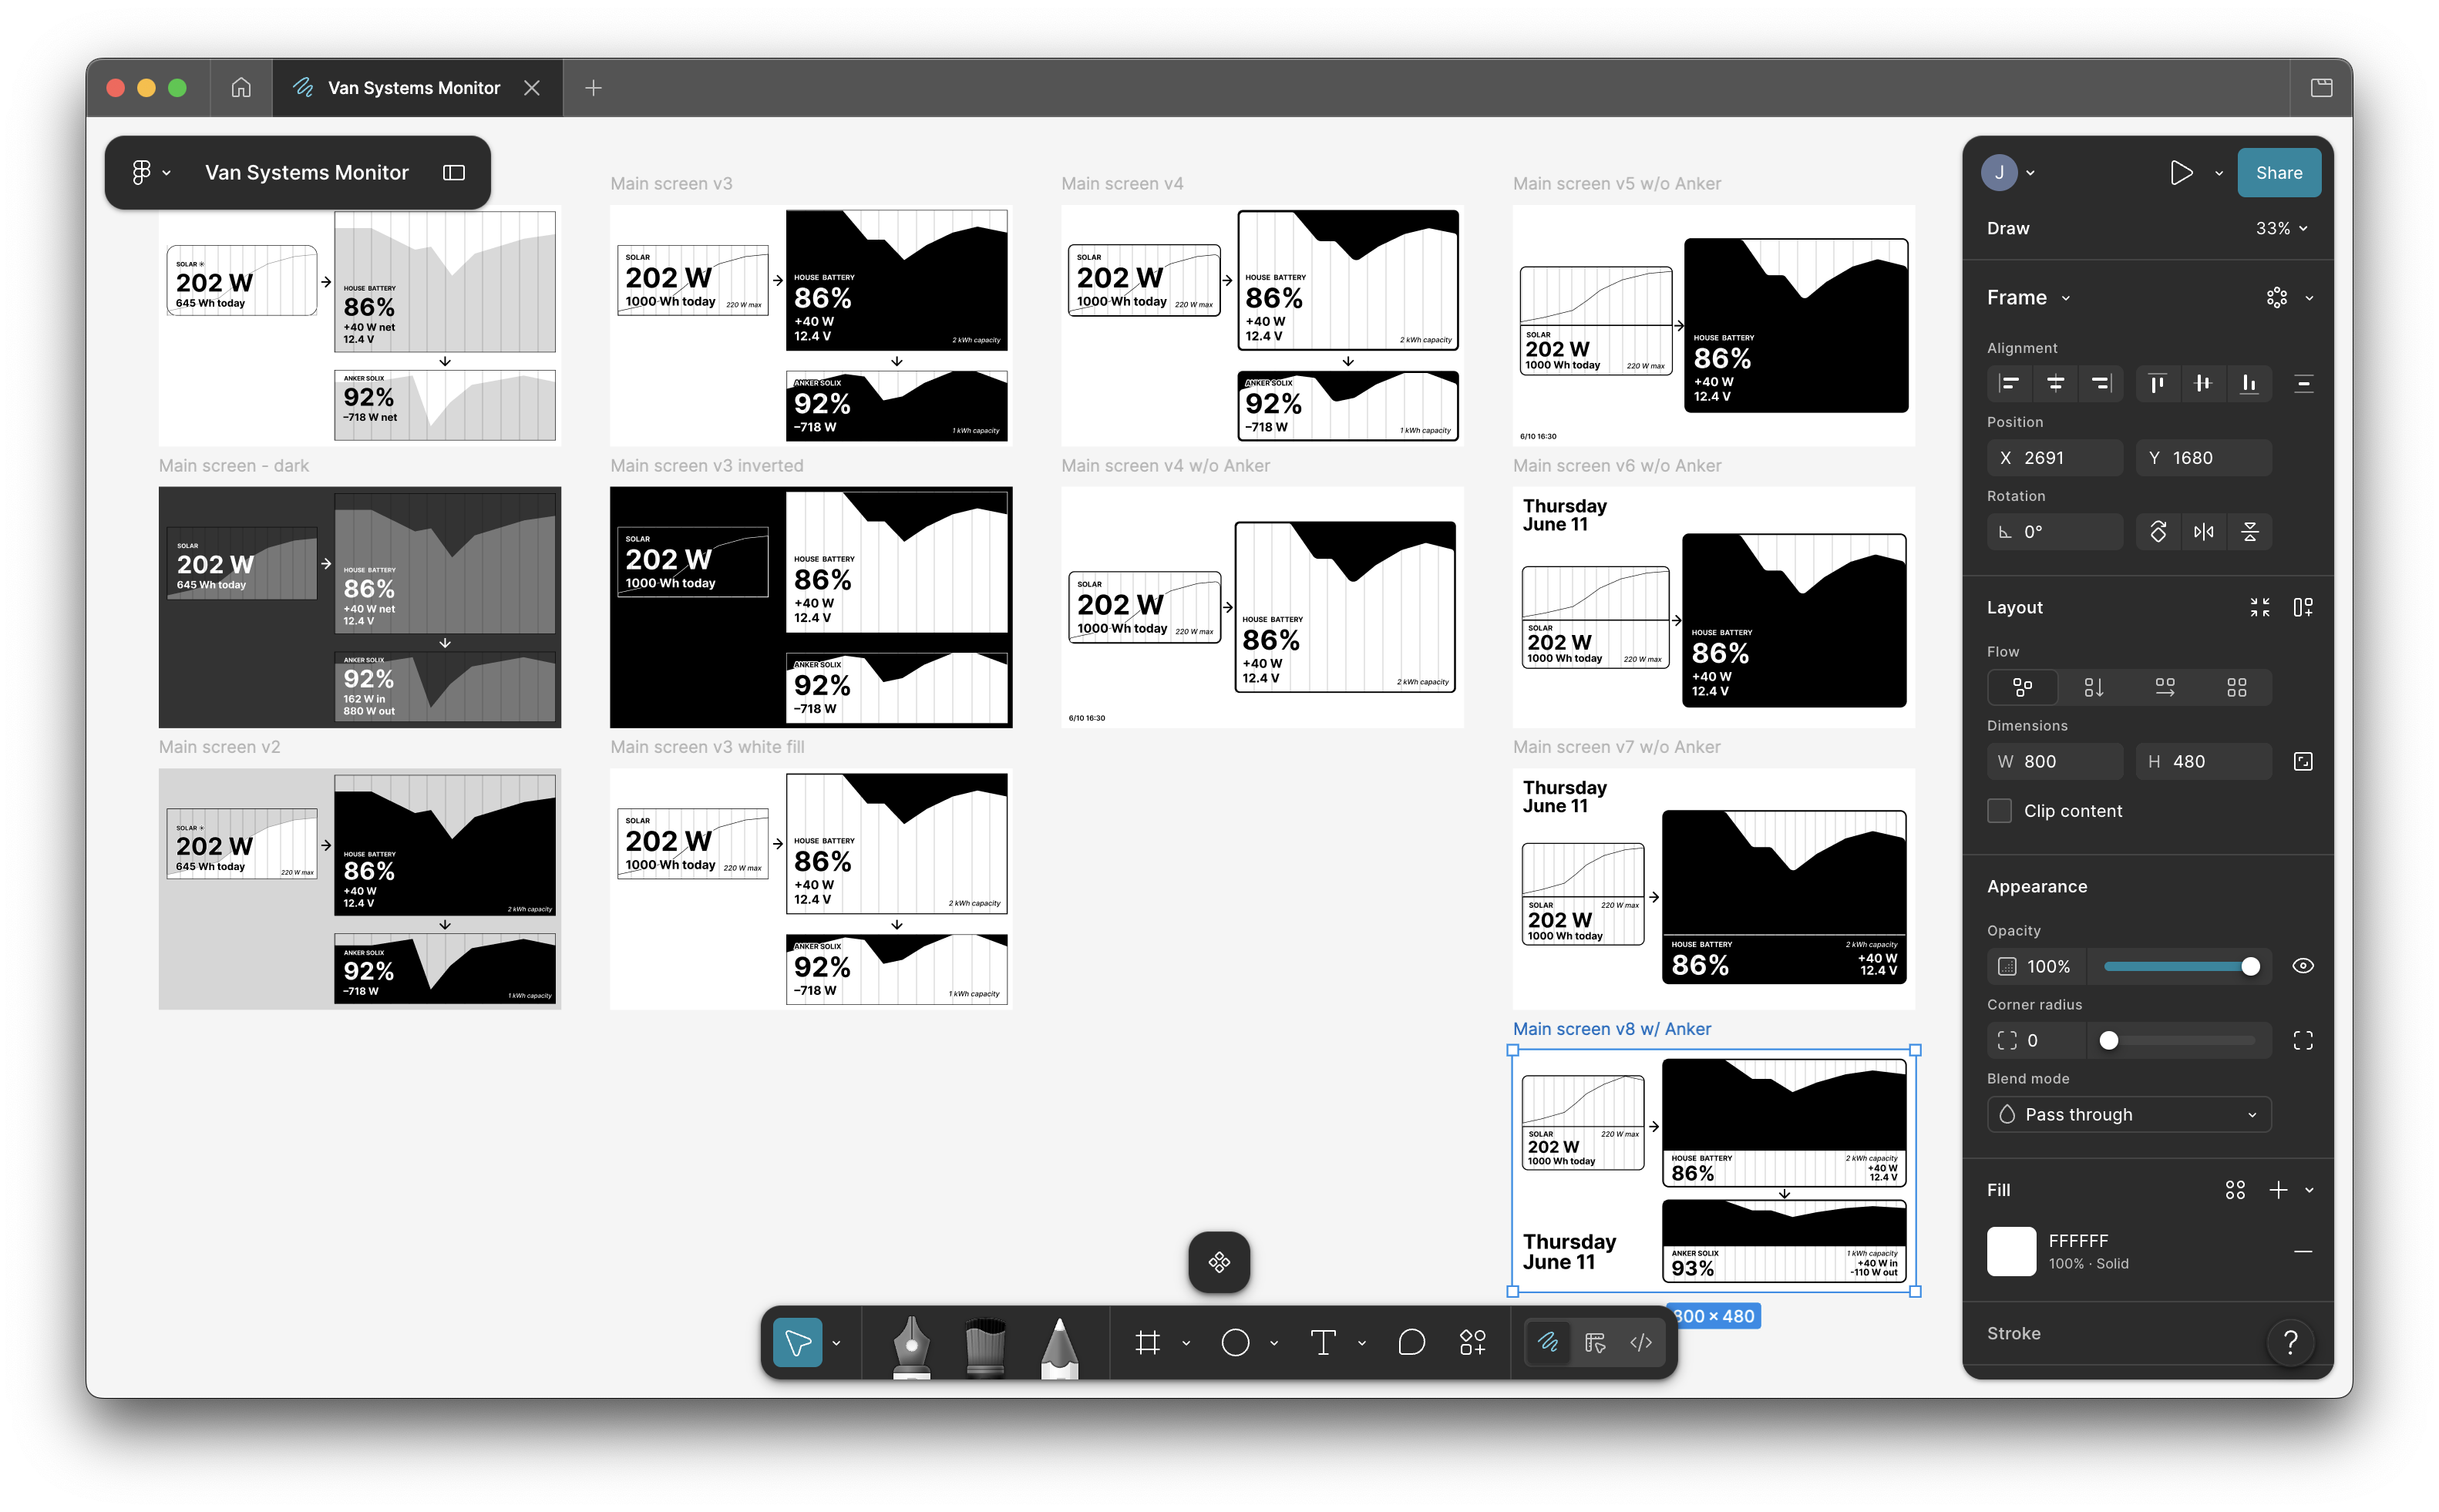
After starting with some hand sketches, I mocked up the UI in Figma and then asked the AI in Cursor to grab my latest design using the Figma MCP. This was my first time using any MCP, as well as my first time touching Figma in years (and even then, I was always a Figma noob). It was very cool how the Cursor agent was able to just take my design from Figma and accurately implement it in the code.
I went through many iterations of the UI design. My early versions had the stats superimposed over the chart, but this proved to be pretty bad for legibility of both stats and chart, so I separated the stats and chart for each device. I also played a lot with which elements were filled black vs. white before settling on the current design in which black represents stored energy. (Thanks to Sharlene for the feedback on my designs!)
In addition, I spent a while experimenting with the gridlines in the charts, trying to balance clarity with visual taste:


In the final design, I deliberately chose to include the date but not the time. When Sharlene and I are out camping, we like to try to lose track of time. We enjoy the feeling of living in a "land without clocks."
The UI is set in the Inter typeface by Rasmus Andersson. I was aware of Inter, but didn't really think much of it until I got to hear Rasmus speak at a coffee chat event a couple of months ago. I liked how he talked about Inter as a typeface which steps back and lets the content speak. I chose Inter early in my design process as a sort of placeholder, and never really felt a need to spend much more time trying other typefaces. One issue I did encounter was that the e-paper display has a very low pixel density, and Inter is not designed for low pixel density, so I had to avoid smaller font sizes or else the text would become illegible. Using a bitmapped font would have solved this, and I may investigate that more in the future.
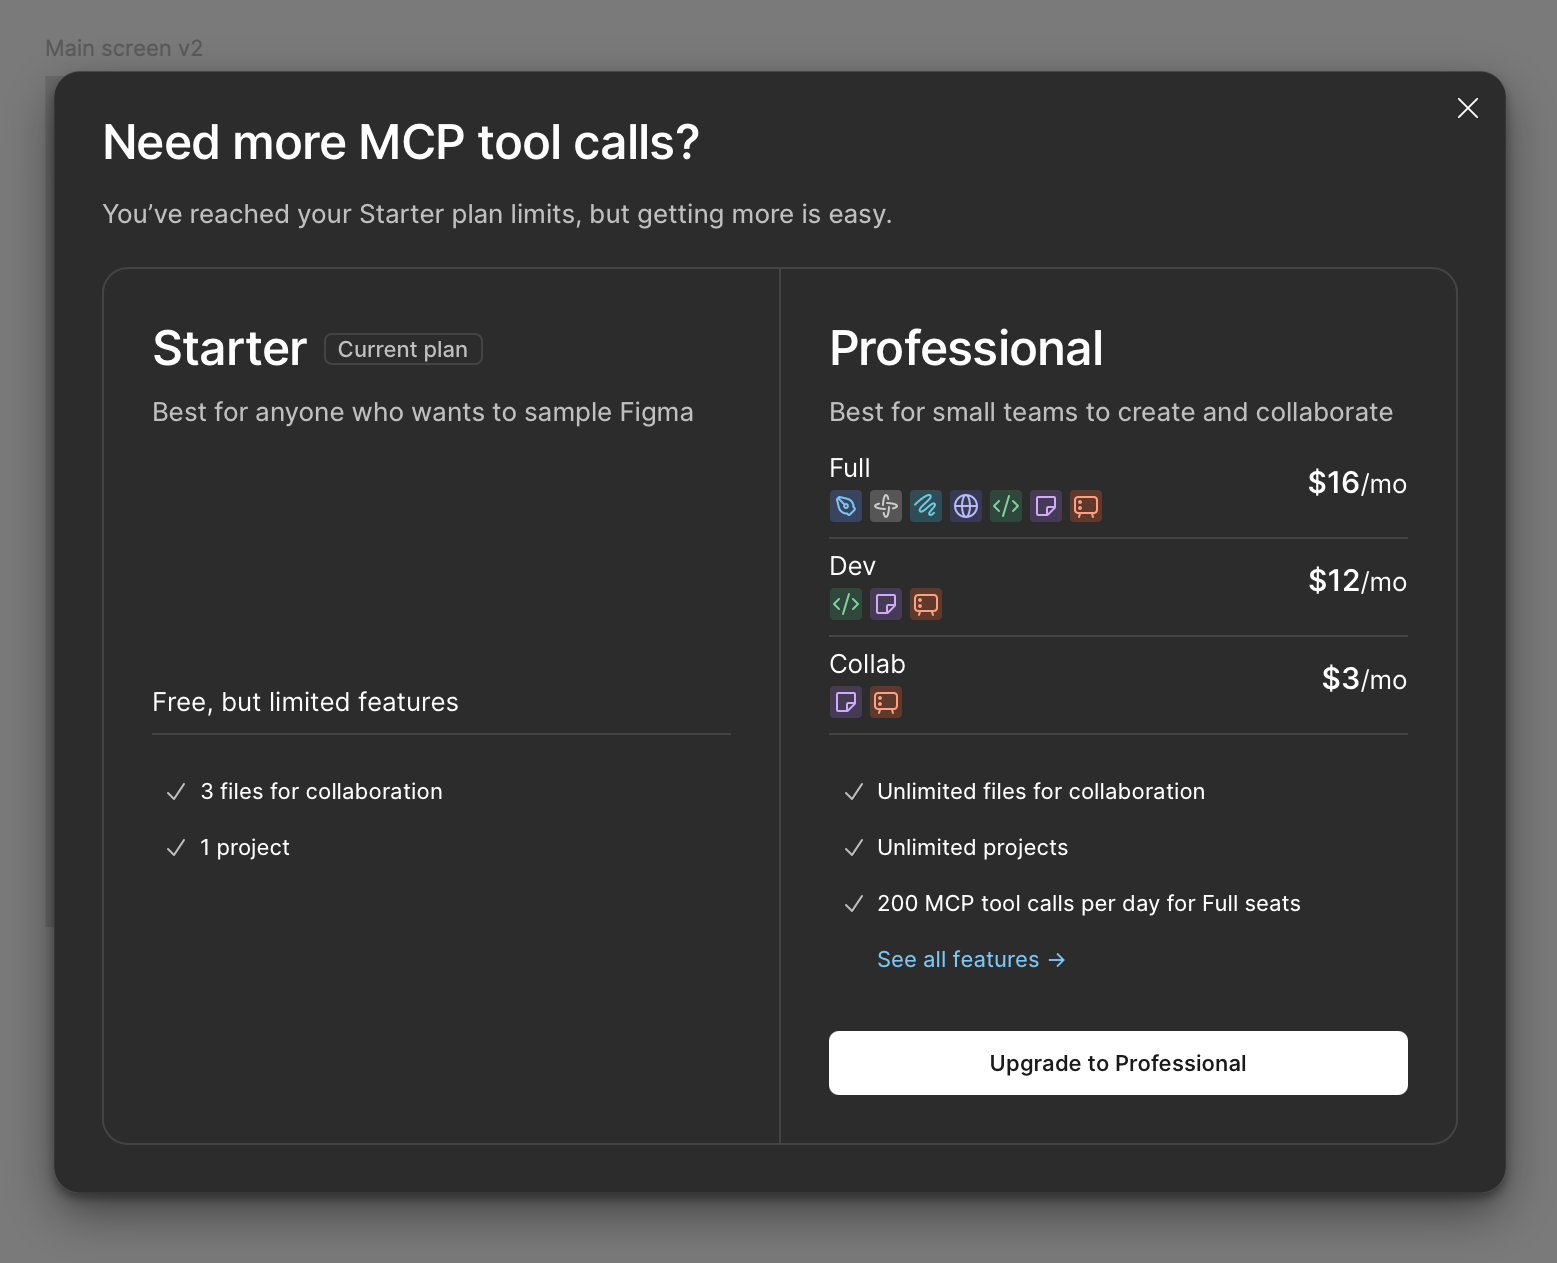
Early in my iterating, I quickly hit Figma's MCP call limit, so I ended up paying for a month of Figma Professional.
Using AI to get data from my Anker Solix power station
In the middle of this project, I discovered that the SolixBLE library didn't actually support telemetry from my specific model of Anker Solix power station (the C1000 Gen 2). There was an open Github issue, but the owner of the repo hadn't had a chance to look at the implementation yet. So I decided to proceed without the Anker Solix component.
Later, after the rest of my project was up and running, I decided to try throwing the AI at this problem to try to get something working. User EugeneDrpc had shared some C++ code in a comment in that Github issue, so I asked the Cursor agent to port this into Python and give me instructions for validating the functionality. I then stepped away for dinner. When I came back, I was able to connect to my Anker power station and get working stats with only brief tinkering. I was pretty impressed with the AI here! Porting and troubleshooting this manually probably would have taken me at least several days.
Conclusions
I'm very happy with where this project ended up. It's certainly not 100% polished, but it's been working pretty flawlessly and serving its purpose well. I no longer have to pull out my phone to check on the van's systems; instead, I just glance at the display.
I really loved thinking about how I wanted the final product to look and feel, and I enjoyed designing and improving the UI. It was also a very manageable amount of hardware complexity, but still a great opportunity do some CAD work. This was a really fun project to build and learn, and I spent hours getting sucked into this project.
If I were to spend more time on this project, I would want to:
- Refine the design of the frame: Remove rough edges and mount the Raspberry Pi and voltage converter properly.
- Validate the reliability and robustness of the system over a longer period of time and more trips.
- Switch back to the SolixBLE library after the maintainer merges in support for the Solix C1000 Gen 2.
Acknowledgements
Thanks to Peter Dietz in the "Winnebago Solis Owners and Wannabees" Facebook group. His post about his Victron Ekrano GX project inspired me by demonstrating how a Linux box could be used to unify data from multiple Bluetooth devices, and by documenting the unused 6-pin Molex connector inside that wall cavity.
In addition, this project built heavily on the work of others, as mentioned throughout this post:
- litime-ble
- SolixBLE, and user EugeneDrpc's C++ code for the C1000 Gen 2
- victron-ble
- Waveshare e-paper display frame by dgurkaynak
- IKEA Skadis pegboard by AU3D
- Raspberry Pi Zero WH enclosure by VINCLER
- Inter by Rasmus Andersson.
Thanks to Kathleen and her family for hosting me and Sharlene at their place in Seattle, where I did much of the work on this project.
Finally, thanks to Sharlene for all her support and feedback!
